AYM Syntex

  • Market Cap: Micro Cap
  • Industry: Garments & Apparels
  • ISIN: INE193B01039
  • NSEID: AYMSYNTEX
  • BSEID: 508933
INR
155.85
0.15 (0.1%)
BSENSE

Dec 05

BSE+NSE Vol: 458

  • Price Points
  • Score
  • Mojo Parameters
  • Total Return
  • News and Corporate Actions
  • Key factors
  • Shareholding
  • Financials
  • CompanyCV
stock-summaryPrice Point
High/Low

1Day

52 Week

Valuation
Technical
Day's Volume

CASH

458 (6,261.11%) Volume

Shareholding (Sep 2025)

FII

3.28%

Held by 9 FIIs

DII

0.41%

Held by 1 DIIs

Promoter

65.90%

Who are the top shareholders of the AYM Syntex?

06-Jun-2025

The top shareholders of AYM Syntex are Mandawewala Enterprises Limited with 62.8%, individual investors holding 23.39%, and Mukul Mahavir Agrawal as the largest public shareholder at 3.93%. Additionally, 9 foreign institutional investors own 3.76%, while mutual funds have minimal involvement.

The top shareholders of AYM Syntex include Mandawewala Enterprises Limited, which holds the highest stake at 62.8%. Other significant shareholders are individual investors, who collectively own 23.39% of the company. Additionally, Mukul Mahavir Agrawal is the highest public shareholder with a holding of 3.93%. The company also has 9 foreign institutional investors (FIIs) that collectively hold 3.76%, while mutual funds have a minimal presence with only 1 scheme holding 0.0%.

Read More

Who are in the management team of AYM Syntex?

06-Jun-2025

As of March 2022, the management team of AYM Syntex includes R R Mandawewala (Chairman), Abhishek Mandawewala (Managing Director & CEO), and several independent directors, ensuring a balanced governance structure.

As of March 2022, the management team of AYM Syntex includes the following members:<BR><BR>1. R R Mandawewala - Chairman (Non-Executive)<BR>2. Atul Desai - Independent Director<BR>3. M K Tandon - Independent Director<BR>4. Abhishek Mandawewala - Managing Director & CEO<BR>5. K H Viswanathan - Independent Director<BR>6. Khushboo Abhishek Mandawewala - Whole-time Director<BR>7. Ashitosh Sheth - Company Secretary & Compliance Officer<BR><BR>This team comprises a mix of executive and independent directors, contributing to the governance and management of the company.

Read More

What does AYM Syntex do?

06-Jun-2025

AYM Syntex Ltd specializes in texturising, draw twisting, and twisting of polyester yarns in the Garments & Apparels industry. As of March 2025, it reported net sales of ₹361 Cr and a net profit of ₹2 Cr, with a market cap of ₹1,471 Cr.

Overview: <BR>AYM Syntex Ltd is engaged in the texturising, draw twisting, and twisting of polyester yarns within the Garments & Apparels industry, classified as a Small Cap company.<BR><BR>History: <BR>Incorporated on 31 March 1983, the company has undergone several name changes, initially starting as Kothari Leasing, then Kothari Polyesters, followed by Welspun Syntex, and finally rebranded to AYM Syntex Ltd on 18 December 2015. The latest quarterly results reported net sales and net profit for the period ending March 2025.<BR><BR>Financial Snapshot: <BR>Most recent Net Sales: 361 Cr (Quarterly Results - Mar 2025) <BR>Most recent Net Profit: 2 Cr (Quarterly Results - Mar 2025) <BR>Market-cap value: Rs 1,471 Cr (Small Cap)<BR><BR>Key Metrics: <BR>P/E: 122.00 <BR>Industry P/E: 23 <BR>Dividend Yield: 0.00% <BR>Debt-Equity: 0.29 <BR>Return on Equity: 2.01% <BR>Price to Book: 2.46 <BR><BR>Contact Details: <BR>Address: Survey No 394 (P), Saily Village Silvassa Dadra & Nagar Haveli (U T) : 396230 <BR>Tel: 91-260-2640596/99 <BR>Email: allcompanysecretaryofwsl@welspun.co <BR>Website: http://www.aymsyntex.com

Read More

Has AYM Syntex declared dividend?

06-Jun-2025

No Dividend History Available

Who are the peers of the AYM Syntex?

03-Jun-2025

AYM Syntex's peers include Trent, Page Industries, K P R Mill Ltd, Vedant Fashions, Trident, Aayush Art, Indo Rama Synth., Monte Carlo Fas., Credo Brands, and Nahar Spinning. In terms of management risk, AYM Syntex is rated average, with a 1-year return of 151.98%, higher than Vedant Fashions but lower than Aayush Art's 650.40%.

Peers: The peers of AYM Syntex are Trent, Page Industries, K P R Mill Ltd, Vedant Fashions, Trident, Aayush Art, Indo Rama Synth., Monte Carlo Fas., Credo Brands, and Nahar Spinning.<BR><BR>Quality Snapshot: Excellent management risk is observed at Page Industries, K P R Mill Ltd, and Vedant Fashions, while Good management risk is found at Trent and Credo Brands. Average management risk is noted for Trident, AYM Syntex, and Nahar Spinning, while Below Average management risk is seen at Aayush Art and Indo Rama Synth. In terms of Growth, Excellent growth is seen at K P R Mill Ltd, while Good growth is noted for Trent and Aayush Art. Below Average growth is observed at Page Industries, Vedant Fashions, Trident, AYM Syntex, and the rest. Capital Structure ratings show Excellent at Page Industries, K P R Mill Ltd, and Vedant Fashions, while Good is found at Trent and Monte Carlo Fas., and Below Average is noted for AYM Syntex, Aayush Art, Indo Rama Synth., and the rest.<BR><BR>Return Snapshot: Aayush Art has the highest 1-year return at 650.40%, while Vedant Fashions has the lowest at -24.65%. AYM Syntex's 1-year return of 151.98% is significantly higher than Vedant Fashions but lower than Aayush Art. Additionally, peers with negative six-month returns include Vedant Fashions, Trident, and Monte Carlo Fas.

Read More

How big is AYM Syntex?

24-Jul-2025

As of 24th July, AYM Syntex Ltd has a market capitalization of 1,319.00 Cr, classifying it as a Small Cap company, with recent Net Sales of 1,489.00 Cr and a Net Profit of 11.63 Cr. Specific values for Shareholder's Funds and Total Assets are unavailable.

As of 24th July, AYM Syntex Ltd has a market capitalization of 1,319.00 Cr, classifying it as a Small Cap company.<BR><BR>In the latest four quarters, AYM Syntex reported Net Sales of 1,489.00 Cr and a Net Profit of 11.63 Cr.<BR><BR>The reporting period for the balance sheet data is the latest annual period, but specific values for Shareholder's Funds and Total Assets are unavailable.

Read More

Is AYM Syntex technically bullish or bearish?

25-Sep-2025

As of September 24, 2025, AYM Syntex has shifted to a bearish trend with moderate strength, indicated by bearish MACD and moving averages, despite mixed signals from Bollinger Bands and Dow Theory suggesting a mildly bearish outlook on the monthly chart.

As of 24 September 2025, the technical trend for AYM Syntex has changed from mildly bearish to bearish. The current stance is bearish with moderate strength. Key indicators driving this include a bearish MACD on the weekly chart, bearish signals from the daily moving averages, and a bearish KST on the weekly timeframe. The Bollinger Bands show a bearish trend on the weekly, despite being bullish on the monthly, indicating mixed signals. The Dow Theory indicates no trend on the weekly and mildly bearish on the monthly, further supporting the bearish outlook. Overall, the combination of these indicators suggests a bearish sentiment in the current market environment.

Read More

When is the next results date for AYM Syntex?

31-Oct-2025

AYM Syntex will announce its results on 08 November 2025.

AYM Syntex is scheduled to declare its results on 08 November 2025.

Read More

Should I buy, sell or hold AYM Syntex?

08-Nov-2025

Are AYM Syntex latest results good or bad?

09-Nov-2025

AYM Syntex's latest results are concerning, with a net loss of ₹0.39 crores and a 13.47% decline in net sales year-on-year. The company is facing operational challenges, raising caution for investors regarding its near-term financial outlook.

AYM Syntex's latest results indicate a challenging financial situation. The company reported a net loss of ₹0.39 crores for the quarter ended September 2025, marking a significant decline of 109.90% year-on-year. Additionally, net sales fell by 13.47% to ₹349.15 crores compared to the same quarter last year. <BR><BR>The operating margin also contracted to 5.56%, down 263 basis points from the previous year, reflecting deteriorating operational efficiency. This marks the second consecutive quarter of losses, raising concerns about the company's ability to maintain profitability amid ongoing industry challenges.<BR><BR>Overall, the results suggest that AYM Syntex is facing serious operational headwinds, leading to a negative outlook for its near-term financial performance. Investors may want to approach with caution given these developments.

Read More

How has been the historical performance of AYM Syntex?

09-Nov-2025

AYM Syntex has shown steady growth in net sales and profitability from March 2008 to March 2025, with net sales increasing to 1,489.00 Cr and profit after tax rising to 11.63 Cr in March 2025. Key metrics like operating profit and earnings per share also improved significantly during this period.

Answer:<BR>The historical performance of AYM Syntex shows a steady growth in net sales and profitability over the years, particularly from March 2008 to March 2025.<BR><BR>Breakdown:<BR>AYM Syntex's net sales increased from 279.78 Cr in March 2008 to 1,489.00 Cr in March 2025, with a notable rise from 1,358.16 Cr in March 2024 and 1,457.78 Cr in March 2023. Total operating income followed a similar trend, reaching 1,489.00 Cr in March 2025. The total expenditure, excluding depreciation, also rose to 1,370.87 Cr in March 2025, up from 1,257.22 Cr in March 2024. Operating profit, excluding other income, improved to 118.13 Cr in March 2025, compared to 100.94 Cr in March 2024 and 95.27 Cr in March 2023. Profit before tax saw a significant increase to 19.36 Cr in March 2025 from just 1.31 Cr in March 2024, leading to a profit after tax of 11.63 Cr, up from 2.03 Cr in the previous year. The earnings per share also reflected this growth, rising to 1.99 in March 2025 from 0.4 in March 2024. Overall, AYM Syntex demonstrated a positive trajectory in both revenue and profitability metrics over the observed period.

Read More

Is AYM Syntex overvalued or undervalued?

11-Nov-2025

As of November 10, 2025, AYM Syntex's valuation grade has improved to attractive, indicating potential undervaluation despite a high PE ratio of 693.61 and low return metrics, suggesting it may present a compelling investment opportunity despite recent underperformance.

As of 10 November 2025, AYM Syntex's valuation grade has moved from fair to attractive, indicating a potential undervaluation. The company appears to be undervalued given its current PE ratio of 693.61, which is significantly higher than its peers such as K P R Mill Ltd at 42.57 and Trident at 32.65. Additionally, AYM Syntex's EV to EBITDA stands at 29.77, which, while high, is lower than the exorbitant valuations seen in some competitors.<BR><BR>In terms of financial health, AYM Syntex has a Price to Book Value of 0.18 and an EV to Sales ratio of 1.93, suggesting that the market may not be fully recognizing the company's asset value. The company's return metrics, with a ROCE of 0.36% and ROE of 0.03%, further highlight the challenges it faces in generating returns. Despite recent underperformance compared to the Sensex, with a YTD return of -30.03% versus the Sensex's 6.91%, the attractive valuation grade suggests that AYM Syntex may offer a compelling investment opportunity moving forward.

Read More

Why is AYM Syntex falling/rising?

04-Dec-2025

As of 04-Dec, AYM Syntex Ltd's stock price is at Rs. 155.75, down 2.17%, and has reached a new 52-week low. The stock has significantly underperformed, with a year-to-date drop of 37.39% and a one-year decline of 43.13%, indicating a bearish trend despite increased investor participation.

As of 04-Dec, AYM Syntex Ltd's stock price is falling, currently at Rs. 155.75, which reflects a decrease of Rs. 3.45 or 2.17%. The stock has been on a downward trend, having lost 7.32% over the last four days. Additionally, it has reached a new 52-week low of Rs. 155.65 today. The performance of the stock has significantly underperformed compared to the sector, with a decline of 1.76% today.<BR><BR>In terms of broader performance metrics, the stock has shown a substantial decline over various periods, including a year-to-date drop of 37.39% and a one-year decline of 43.13%. It is also trading below its moving averages across multiple time frames, indicating a bearish trend. Despite a notable increase in investor participation, with delivery volume rising by 217.2% against the five-day average, the overall sentiment remains negative as the stock continues to struggle against both market benchmarks and its historical performance.

Read More
iScoreScore
Click here to find our call on this stock
Strong Sell
Sell
Hold
Buy
Strong Buy

MarketsMojo — Loved in India, Now Global

The power of Mojo is now in 29 countries. Explore global equities with the same cutting-edge features you love.

Dashboard
1

Weak Long Term Fundamental Strength with an average Return on Capital Employed (ROCE) of 5.34%

  • Poor long term growth as Net Sales has grown by an annual rate of 3.12% and Operating profit at 7.63% over the last 5 years
  • Company's ability to service its debt is weak with a poor EBIT to Interest (avg) ratio of 0.95
2

The company has declared Negative results for the last 3 consecutive quarters

3

Despite the size of the company, domestic mutual funds hold only 0% of the company

4

Underperformed the market in the last 1 year

stock-summaryMojo Parameters
Mojo Parameters
Loading Valuation Snapshot...
Stock DNA
stock-summary
Industry

Garments & Apparels

stock-summary
Market cap

INR 913 Cr (Micro Cap)

stock-summary
P/E

621.00

stock-summary
Industry P/E

52

stock-summary
Dividend Yield

0.00%

stock-summary
Debt Equity

0.39

stock-summary
Return on Equity

0.26%

stock-summary
Price to Book

1.59

Revenue and Profits:
Net Sales:
349 Cr
(Quarterly Results - Sep 2025)
Net Profit:
0 Cr
stock-summaryTotal Returns
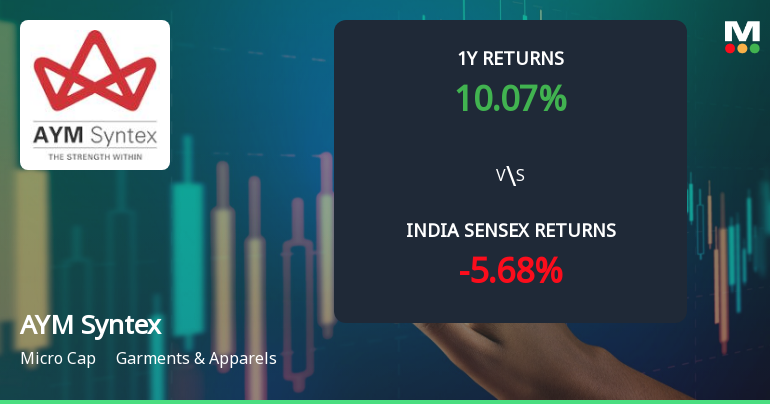
Total Returns (Price + Dividend) stock-summary
Dividend Yield (0%)
TimePeriod
Price Return
Dividend Return
Total Return
3 Months
-16.95%
0%
-16.95%
6 Months
-35.73%
0%
-35.73%
1 Year
-44.34%
0%
-44.34%
2 Years
127.15%
0%
127.15%
3 Years
104.13%
0%
104.13%
4 Years
57.27%
0%
57.27%
5 Years
239.17%
0%
239.17%

AYM Syntex for the last several years.

Risk Adjusted Returns v/s stock-summary
Returns Beta
Icon
Beta has not been calculated since enough price history is not available
stock-summaryNews & Corporate Actions
News
Announcements stock-summary

Announcement under Regulation 30 (LODR)-Change in Management

01-Dec-2025 | Source : BSE

Disclosure under Regulation 30 (LODR) - Change in Management

Announcement under Regulation 30 (LODR)-Newspaper Publication

10-Nov-2025 | Source : BSE

Newspaper Publication of the Unaudited Standalone and Consolidated Financial Results of the Company for the quarter and half year ended September 30 2025.

Announcement under Regulation 30 (LODR)-Monitoring Agency Report

10-Nov-2025 | Source : BSE

Monitoring Agency Report for the quarter ended September 30 2025

Corporate Actions stock-summary
stock-summary
BOARD MEETING

No Upcoming Board Meetings

stock-summary
DIVIDEND

No Dividend history available

stock-summary
SPLITS

No Splits history available

stock-summary
BONUS

No Bonus history available

stock-summary
RIGHTS

No Rights history available

stock-summaryKey Factors
Quality key factors stock-summary
Factor
Value
Sales Growth (5y)
3.12%
EBIT Growth (5y)
7.63%
EBIT to Interest (avg)
0.95
Debt to EBITDA (avg)
3.27
Net Debt to Equity (avg)
0.39
Sales to Capital Employed (avg)
1.77
Tax Ratio
59.73%
Dividend Payout Ratio
0
Pledged Shares
0
Institutional Holding
3.69%
ROCE (avg)
5.48%
ROE (avg)
1.62%
Valuation key factors
Factor
Value
P/E Ratio
621
Industry P/E
52
Price to Book Value
1.59
EV to EBIT
41.78
EV to EBITDA
12.39
EV to Capital Employed
1.42
EV to Sales
0.80
PEG Ratio
NA
Dividend Yield
NA
ROCE (Latest)
3.41%
ROE (Latest)
0.26%
Technicals key factors
Indicator
Weekly
Monthly
MACD
Bearish
Mildly Bearish
RSI
No Signal
No Signal
Bollinger Bands
Bearish
Bearish
Moving Averages
Bearish (Daily)
KST
Bearish
Mildly Bearish
Dow Theory
Mildly Bearish
Mildly Bearish
OBV
Mildly Bearish
Mildly Bearish
stock-summary Technical Indicator Scale: Bearish, Mildly Bearish, Sideways, Mildly Bullish, Bullish  Turned 
stock-summaryShareholding
Shareholding Snapshot : Sep 2025stock-summary
Shareholding Compare (%holding) stock-summary
Majority shareholders

Promoters

Pledged Promoter Holdings

None

Mutual Funds

Held by 1 Schemes (0.0%)

FIIs

Held by 9 FIIs (3.28%)

Promoter with highest holding

Mandawewala Enterprises Limited (62.71%)

Highest Public shareholder

Mukul Mahavir Agrawal (3.93%)

Individual Investors Holdings

23.69%

stock-summaryFinancial
[
  {
    "link": "quarterly",
    "btn_text": "All Quarterly Results",
    "header": "Quarterly Results Snapshot (Consolidated) - Sep'25 - YoY",
    "rhs": [
      {
        "prefix": "Net Sales ",
        "suffix": "YoY Growth in quarter ended Sep 2025 is -13.47% vs 21.05% in Sep 2024",
        "dir": -1
      },
      {
        "prefix": "Consolidated Net Profit ",
        "suffix": "YoY Growth in quarter ended Sep 2025 is -109.90% vs 179.76% in Sep 2024",
        "dir": -1
      }
    ],
    "table": {
      "header": [
        "Sep'25",
        "Sep'24",
        "Change(%)"
      ],
      "body": [
        {
          "field": "Net Sales",
          "val1": "349.15",
          "val2": "403.52",
          "chgp": "-13.47%",
          "chgp_class": "negative"
        },
        {
          "field": "Operating Profit (PBDIT) excl Other Income",
          "val1": "19.42",
          "val2": "33.06",
          "chgp": "-41.26%",
          "chgp_class": "negative"
        },
        {
          "field": "Interest",
          "val1": "8.31",
          "val2": "12.67",
          "chgp": "-34.41%",
          "chgp_class": "positive"
        },
        {
          "field": "Exceptional Items",
          "val1": "0.00",
          "val2": "0.00",
          "chgp": "",
          "chgp_class": "neutral"
        },
        {
          "field": "Consolidate Net Profit",
          "val1": "-0.39",
          "val2": "3.94",
          "chgp": "-109.90%",
          "chgp_class": "negative"
        },
        {
          "field": "Operating Profit Margin (Excl OI)",
          "val1": "5.56%",
          "val2": "8.19%",
          "chgp": "-2.63%",
          "chgp_class": "negative"
        }
      ]
    }
  },
  {
    "link": "half-yearly",
    "btn_text": "All Half Yearly Results",
    "header": "Half Yearly Results Snapshot (Consolidated) - Sep'25",
    "rhs": [
      {
        "prefix": "Net Sales ",
        "suffix": " Growth in half year ended Sep 2025 is -10.00% vs 14.98% in Sep 2024",
        "dir": -1
      },
      {
        "prefix": "Consolidated Net Profit ",
        "suffix": " Growth in half year ended Sep 2025 is -163.61% vs 137.87% in Sep 2024",
        "dir": -1
      }
    ],
    "table": {
      "header": [
        "Sep'25",
        "Sep'24",
        "Change(%)"
      ],
      "body": [
        {
          "field": "Net Sales",
          "val1": "675.63",
          "val2": "750.71",
          "chgp": "-10.00%",
          "chgp_class": "negative"
        },
        {
          "field": "Operating Profit (PBDIT) excl Other Income",
          "val1": "36.09",
          "val2": "62.51",
          "chgp": "-42.27%",
          "chgp_class": "negative"
        },
        {
          "field": "Interest",
          "val1": "15.90",
          "val2": "24.39",
          "chgp": "-34.81%",
          "chgp_class": "positive"
        },
        {
          "field": "Exceptional Items",
          "val1": "0.00",
          "val2": "0.00",
          "chgp": "",
          "chgp_class": "neutral"
        },
        {
          "field": "Consolidate Net Profit",
          "val1": "-3.95",
          "val2": "6.21",
          "chgp": "-163.61%",
          "chgp_class": "negative"
        },
        {
          "field": "Operating Profit Margin (Excl OI)",
          "val1": "5.34%",
          "val2": "8.33%",
          "chgp": "-2.99%",
          "chgp_class": "negative"
        }
      ]
    }
  },
  {
    "link": "nine-monthly",
    "btn_text": "All Nine Monthly Results",
    "header": "Nine Monthly Results Snapshot (Consolidated) - Dec'24",
    "rhs": [
      {
        "prefix": "Net Sales ",
        "suffix": "YoY Growth in nine months ended Dec 2024 is 14.64% vs -12.76% in Dec 2023",
        "dir": 1
      },
      {
        "prefix": "Consolidated Net Profit ",
        "suffix": "YoY Growth in nine months ended Dec 2024 is 155.48% vs -376.24% in Dec 2023",
        "dir": 1
      }
    ],
    "table": {
      "header": [
        "Dec'24",
        "Dec'23",
        "Change(%)"
      ],
      "body": [
        {
          "field": "Net Sales",
          "val1": "1,128.38",
          "val2": "984.27",
          "chgp": "14.64%",
          "chgp_class": "positive"
        },
        {
          "field": "Operating Profit (PBDIT) excl Other Income",
          "val1": "91.43",
          "val2": "60.76",
          "chgp": "50.48%",
          "chgp_class": "positive"
        },
        {
          "field": "Interest",
          "val1": "34.21",
          "val2": "31.54",
          "chgp": "8.47%",
          "chgp_class": "negative"
        },
        {
          "field": "Exceptional Items",
          "val1": "0.00",
          "val2": "-17.55",
          "chgp": "100.00%",
          "chgp_class": "positive"
        },
        {
          "field": "Consolidate Net Profit",
          "val1": "9.61",
          "val2": "-17.32",
          "chgp": "155.48%",
          "chgp_class": "positive"
        },
        {
          "field": "Operating Profit Margin (Excl OI)",
          "val1": "8.10%",
          "val2": "6.17%",
          "chgp": "1.93%",
          "chgp_class": "positive"
        }
      ]
    }
  },
  {
    "link": "annual",
    "btn_text": "All Annual Results",
    "header": "Annual Results Snapshot (Consolidated) - Mar'25",
    "rhs": [
      {
        "prefix": "Net Sales ",
        "suffix": "YoY Growth in year ended Mar 2025 is 9.63% vs -6.83% in Mar 2024",
        "dir": 1
      },
      {
        "prefix": "Consolidated Net Profit ",
        "suffix": "YoY Growth in year ended Mar 2025 is 472.91% vs -71.65% in Mar 2024",
        "dir": 1
      }
    ],
    "table": {
      "header": [
        "Mar'25",
        "Mar'24",
        "Change(%)"
      ],
      "body": [
        {
          "field": "Net Sales",
          "val1": "1,489.00",
          "val2": "1,358.16",
          "chgp": "9.63%",
          "chgp_class": "positive"
        },
        {
          "field": "Operating Profit (PBDIT) excl Other Income",
          "val1": "118.13",
          "val2": "100.94",
          "chgp": "17.03%",
          "chgp_class": "positive"
        },
        {
          "field": "Interest",
          "val1": "42.77",
          "val2": "42.03",
          "chgp": "1.76%",
          "chgp_class": "negative"
        },
        {
          "field": "Exceptional Items",
          "val1": "0.00",
          "val2": "-6.61",
          "chgp": "100.00%",
          "chgp_class": "positive"
        },
        {
          "field": "Consolidate Net Profit",
          "val1": "11.63",
          "val2": "2.03",
          "chgp": "472.91%",
          "chgp_class": "positive"
        },
        {
          "field": "Operating Profit Margin (Excl OI)",
          "val1": "7.93%",
          "val2": "7.43%",
          "chgp": "0.50%",
          "chgp_class": "positive"
        }
      ]
    }
  }
]
Quarterly Results Snapshot (Consolidated) - Sep'25 - YoYstock-summary
Sep'25
Sep'24
Change(%)
Net Sales
349.15
403.52
-13.47%
Operating Profit (PBDIT) excl Other Income
19.42
33.06
-41.26%
Interest
8.31
12.67
-34.41%
Exceptional Items
0.00
0.00
Consolidate Net Profit
-0.39
3.94
-109.90%
Operating Profit Margin (Excl OI)
5.56%
8.19%
-2.63%
Values in Rs Cr.
Direction Arrows
Net Sales

YoY Growth in quarter ended Sep 2025 is -13.47% vs 21.05% in Sep 2024

Direction Arrows
Consolidated Net Profit

YoY Growth in quarter ended Sep 2025 is -109.90% vs 179.76% in Sep 2024

Half Yearly Results Snapshot (Consolidated) - Sep'25stock-summary
Sep'25
Sep'24
Change(%)
Net Sales
675.63
750.71
-10.00%
Operating Profit (PBDIT) excl Other Income
36.09
62.51
-42.27%
Interest
15.90
24.39
-34.81%
Exceptional Items
0.00
0.00
Consolidate Net Profit
-3.95
6.21
-163.61%
Operating Profit Margin (Excl OI)
5.34%
8.33%
-2.99%
Values in Rs Cr.
Direction Arrows
Net Sales

Growth in half year ended Sep 2025 is -10.00% vs 14.98% in Sep 2024

Direction Arrows
Consolidated Net Profit

Growth in half year ended Sep 2025 is -163.61% vs 137.87% in Sep 2024

Nine Monthly Results Snapshot (Consolidated) - Dec'24stock-summary
Dec'24
Dec'23
Change(%)
Net Sales
1,128.38
984.27
14.64%
Operating Profit (PBDIT) excl Other Income
91.43
60.76
50.48%
Interest
34.21
31.54
8.47%
Exceptional Items
0.00
-17.55
100.00%
Consolidate Net Profit
9.61
-17.32
155.48%
Operating Profit Margin (Excl OI)
8.10%
6.17%
1.93%
Values in Rs Cr.
Direction Arrows
Net Sales

YoY Growth in nine months ended Dec 2024 is 14.64% vs -12.76% in Dec 2023

Direction Arrows
Consolidated Net Profit

YoY Growth in nine months ended Dec 2024 is 155.48% vs -376.24% in Dec 2023

Annual Results Snapshot (Consolidated) - Mar'25stock-summary
Mar'25
Mar'24
Change(%)
Net Sales
1,489.00
1,358.16
9.63%
Operating Profit (PBDIT) excl Other Income
118.13
100.94
17.03%
Interest
42.77
42.03
1.76%
Exceptional Items
0.00
-6.61
100.00%
Consolidate Net Profit
11.63
2.03
472.91%
Operating Profit Margin (Excl OI)
7.93%
7.43%
0.50%
Values in Rs Cr.
Direction Arrows
Net Sales

YoY Growth in year ended Mar 2025 is 9.63% vs -6.83% in Mar 2024

Direction Arrows
Consolidated Net Profit

YoY Growth in year ended Mar 2025 is 472.91% vs -71.65% in Mar 2024

stock-summaryCompany CV
About AYM Syntex Ltd stock-summary
stock-summary
AYM Syntex Ltd
Micro Cap
Garments & Apparels
AYM Syntex Ltd., incorporated on 31 Mar.'83 as Kothari Leasing, the company changed its name to Kothari Polyesters on 15 Mar.'91 and to Welspun Syntex (WSL) on 26 Jul.'91. The company was promoted by G R Goenka, B K Goenka, S K Goenka and R R Mandawewala. Welspun Syntex Limited was renamed as AYM Syntex Ltd with effect from 18th December 2015. WSL is engaged in texturising, draw twisting and twisting of polyester yarns.
Company Coordinates stock-summary
Company Details
Survey No 394 (P), Saily Village Silvassa Dadra & Nagar Haveli (U T) : 396230
stock-summary
Tel: 91-260-2640596/99
stock-summary
allcompanysecretaryofwsl@welspun.co
Registrar Details
Link Intime India Pvt Ltd, C-13 Pannalal Silk Compound, L B S Marg, Bhandup , Mumbai