
Compare Azad India with Similar Stocks
Dashboard
Poor Management Efficiency with a low ROE of 0.37%
- The company has been able to generate a Return on Equity (avg) of 0.37% signifying low profitability per unit of shareholders funds
With ROE of 1.8, it has a Very Expensive valuation with a 4.2 Price to Book Value
Underperformed the market in the last 1 year
Stock DNA
Iron & Steel Products
INR 558 Cr (Micro Cap)
233.00
90
0.00%
-0.13
1.83%
4.12
Total Returns (Price + Dividend) 
Azad India for the last several years.
Risk Adjusted Returns v/s
Returns Beta

News
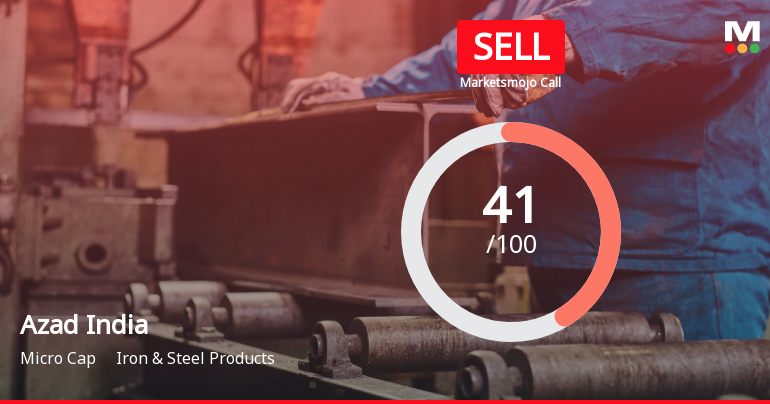
Azad India Mobility Ltd is Rated Sell
Azad India Mobility Ltd is rated 'Sell' by MarketsMOJO, with this rating last updated on 01 June 2026. However, the analysis and financial metrics discussed here reflect the stock's current position as of 09 June 2026, providing investors with the most recent and relevant data to assess the company’s outlook.
Read full news article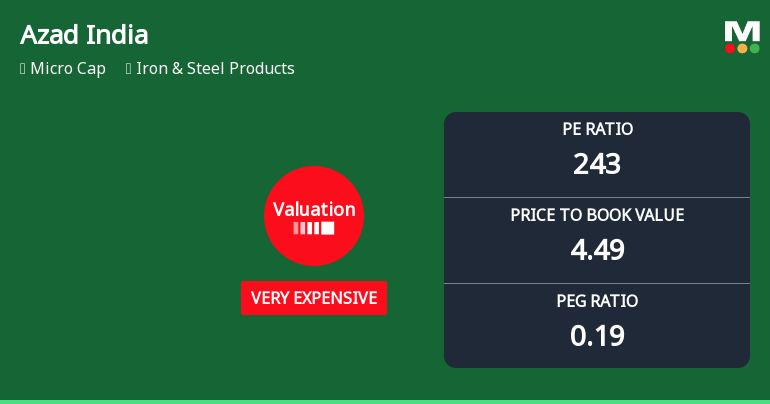
Azad India Mobility Ltd Valuation Shifts Highlight Price Attractiveness Challenges
Azad India Mobility Ltd, a micro-cap player in the Iron & Steel Products sector, has seen a notable shift in its valuation parameters, prompting a reassessment of its price attractiveness. Despite a slight dip in share price, the company’s elevated price-to-earnings and price-to-book ratios, alongside subdued returns on capital, raise questions about its investment appeal relative to peers and historical benchmarks.
Read full news article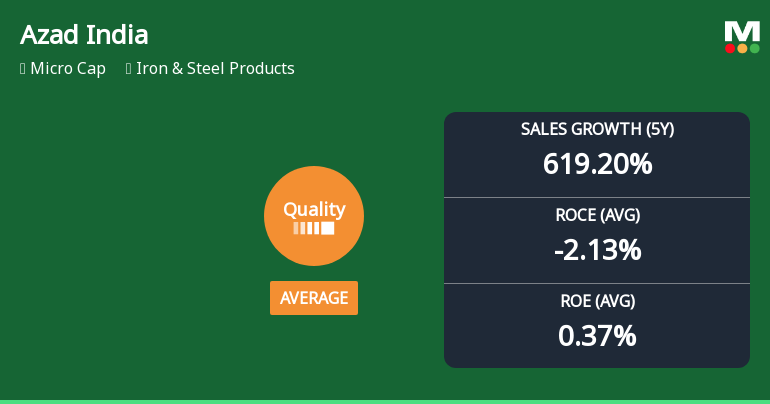
Azad India Mobility Ltd Quality Grade Upgrade Signals Mixed Business Fundamentals
Azad India Mobility Ltd, a micro-cap player in the Iron & Steel Products sector, has seen its quality grade improve from below average to average as of 1 June 2026. This upgrade reflects a nuanced shift in the company’s business fundamentals, with notable improvements in sales and earnings growth but persistent challenges in returns and capital efficiency. Investors should weigh these developments carefully amid the company’s volatile stock performance and sector dynamics.
Read full news article Announcements
Announcement under Regulation 30 (LODR)-Resignation of Director
29-May-2026 | Source : BSEResignation of Mr. Ramesh Chandra Pareek from the post of the Independent Director of the Company.
Board Meeting Outcome for Board Meeting Held On Friday May 29 2026 .
29-May-2026 | Source : BSEApproval of Audited Standalone and Consolidated Financials for the quarter and year ended 31st March2026.
Appointment Of Mrs. Sabina Khurana As A Chief Executive Officer (CEO) Of The Company.
29-May-2026 | Source : BSEAppointment of Mrs. Sabina Khurana as a Chief Executive Officer (CEO) of the Company .
Corporate Actions

No Upcoming Board Meetings

No Dividend history available

No Splits history available

No Bonus history available

No Rights history available
Quality key factors
Valuation key factors
Technicals key factors
 Technical Indicator Scale: Bearish, Mildly Bearish, Sideways, Mildly Bullish, Bullish Turned
 Shareholding Snapshot : Mar 2026
Shareholding Compare (%holding)
FIIs
None
Held by 0 Schemes
Held by 9 FIIs (48.7%)
Bupinder Singh Chadha (9.32%)
3 Sigma Global Fund (13.78%)
22.91%
Quarterly Results Snapshot (Consolidated) - Mar'26 - YoY

YoY Growth in quarter ended Mar 2026 is -2.99% vs 0.00% in Mar 2025
YoY Growth in quarter ended Mar 2026 is 683.33% vs 1,000.00% in Mar 2025
Half Yearly Results Snapshot (Standalone) - Sep'25
Growth in half year ended Sep 2025 is 0.00% vs 0.00% in Sep 2024

Growth in half year ended Sep 2025 is 850.00% vs 55.56% in Sep 2024
Nine Monthly Results Snapshot (Standalone) - Dec'25
YoY Growth in nine months ended Dec 2025 is 0.00% vs 0.00% in Dec 2024
YoY Growth in nine months ended Dec 2025 is 451.85% vs -58.82% in Dec 2024
Annual Results Snapshot (Consolidated) - Mar'26
YoY Growth in year ended Mar 2026 is 619.16% vs 0.00% in Mar 2025
YoY Growth in year ended Mar 2026 is 7,800.00% vs 102.48% in Mar 2025
About Azad India Mobility Ltd

Company Coordinates


