
Compare B&B Triplewall with Similar Stocks
Dashboard
Weak Long Term Fundamental Strength with an average Return on Capital Employed (ROCE) of 9.44%
- Poor long term growth as Operating profit has grown by an annual rate 17.55% of over the last 5 years
- Low ability to service debt as the company has a high Debt to EBITDA ratio of 2.60 times
With a growth in Net Profit of 89.36%, the company declared Outstanding results in Mar 26
With ROCE of 13.1, it has a Attractive valuation with a 1.8 Enterprise value to Capital Employed
Majority shareholders : Promoters
Market Beating Performance
Total Returns (Price + Dividend) 
Latest dividend: 1 per share ex-dividend date: Sep-23-2024
Risk Adjusted Returns v/s
Returns Beta

News

B&B Triplewall Containers Ltd is Rated Hold
B&B Triplewall Containers Ltd is rated 'Hold' by MarketsMOJO, with this rating last updated on 03 June 2026. However, the analysis and financial metrics discussed here reflect the stock's current position as of 18 July 2026, providing investors with an up-to-date view of the company’s performance and outlook.
Read full news article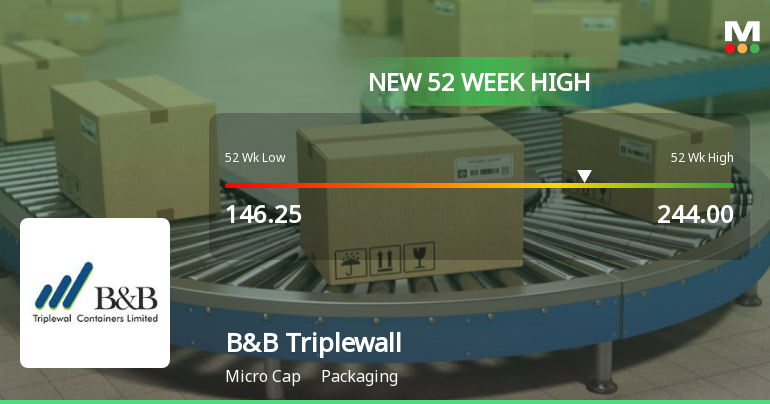
B&B Triplewall Containers Ltd Hits New 52-Week High of Rs 244 on Back of Strong Technical Signals
A surge in momentum propelled B&B Triplewall Containers Ltd to a fresh 52-week high of Rs 244 on 13 Jul 2026, marking a significant milestone in its price journey. This advance comes amid a backdrop of robust technical indicators aligning to support the rally, even as the broader market showed signs of weakness.
Read full news article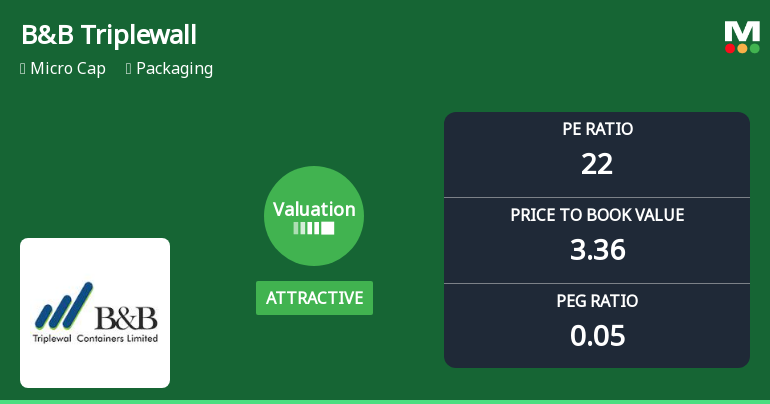
B&B Triplewall Containers Ltd Valuation Shifts Signal Renewed Price Attractiveness
B&B Triplewall Containers Ltd has witnessed a notable shift in its valuation parameters, moving from a fair to an attractive rating, reflecting improved price appeal amid a mixed packaging sector landscape. This article analyses the company’s current price-to-earnings (P/E) and price-to-book value (P/BV) ratios in comparison to historical averages and peer benchmarks, providing investors with a comprehensive view of its market positioning and potential investment merit.
Read full news article Announcements
Compliances-Certificate under Reg. 74 (5) of SEBI (DP) Regulations 2018
07-Jul-2026 | Source : BSECertificate under Reg 74(5) of SEBI (DP) Regulation 2018
Closure of Trading Window
30-Jun-2026 | Source : BSEClosure of trading window
Announcement under Regulation 30 (LODR)-Newspaper Publication
31-May-2026 | Source : BSENewspaper Advertisement of Audited Financial Results for the quarter and financial year ended on March 31 2026
Corporate Actions

No Upcoming Board Meetings

B&B Triplewall Containers Ltd has declared 10% dividend, ex-date: 23 Sep 24

No Splits history available

No Bonus history available

No Rights history available
Quality key factors
Valuation key factors
Technicals key factors
 Technical Indicator Scale: Bearish, Mildly Bearish, Sideways, Mildly Bullish, Bullish Turned
 Shareholding Snapshot : Mar 2026
Shareholding Compare (%holding)
Promoters
None
Held by 0 Schemes
Held by 0 FIIs
Alka Gupta (11.68%)
Binjusaria Papers Pvt Ltd (4.25%)
18.34%
Quarterly Results Snapshot (Consolidated) - Mar'26 - QoQ

QoQ Growth in quarter ended Mar 2026 is 4.45% vs 6.22% in Dec 2025

QoQ Growth in quarter ended Mar 2026 is 84.01% vs 5.78% in Dec 2025
Half Yearly Results Snapshot (Consolidated) - Sep'25
Growth in half year ended Sep 2025 is 31.68% vs 25.30% in Sep 2024
Growth in half year ended Sep 2025 is 127.15% vs -70.21% in Sep 2024
Nine Monthly Results Snapshot (Consolidated) - Dec'25
YoY Growth in nine months ended Dec 2025 is 29.65% vs 28.50% in Dec 2024
YoY Growth in nine months ended Dec 2025 is 412.16% vs -127.67% in Dec 2024
Annual Results Snapshot (Consolidated) - Mar'26
YoY Growth in year ended Mar 2026 is 25.34% vs 31.00% in Mar 2025
YoY Growth in year ended Mar 2026 is 473.24% vs -133.64% in Mar 2025
About B&B Triplewall Containers Ltd

Company Coordinates


