
Compare B&B Triplewall with Similar Stocks
Dashboard
Weak Long Term Fundamental Strength with an average Return on Capital Employed (ROCE) of 9.44%
- Poor long term growth as Operating profit has grown by an annual rate 17.55% of over the last 5 years
- Low ability to service debt as the company has a high Debt to EBITDA ratio of 2.60 times
With a growth in Net Profit of 89.36%, the company declared Outstanding results in Mar 26
With ROCE of 13.1, it has a Fair valuation with a 1.9 Enterprise value to Capital Employed
Majority shareholders : Promoters
Market Beating Performance
Total Returns (Price + Dividend) 
Latest dividend: 1 per share ex-dividend date: Sep-23-2024
Risk Adjusted Returns v/s
Returns Beta

News
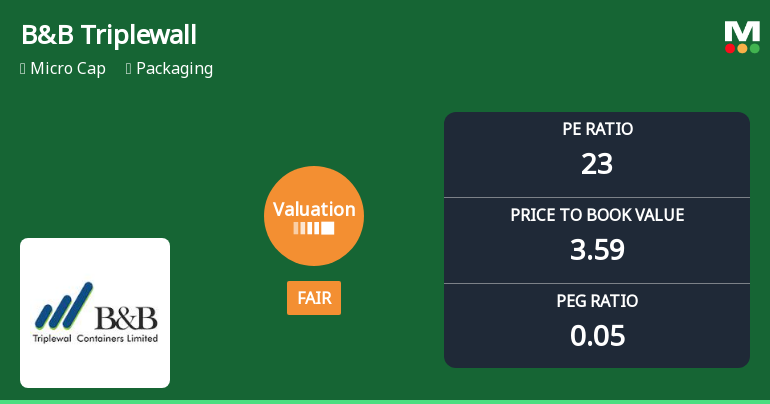
B&B Triplewall Containers Ltd Valuation Shifts Amid Strong Market Performance
B&B Triplewall Containers Ltd has witnessed a notable shift in its valuation parameters, moving from an attractive to a fair rating, reflecting evolving market perceptions amid robust stock performance. This recalibration comes as the packaging micro-cap continues to outperform the broader Sensex, prompting investors to reassess its price attractiveness relative to peers and historical benchmarks.
Read full news article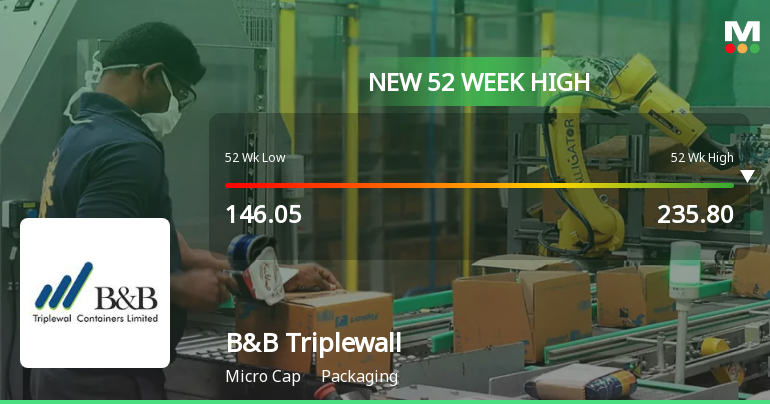
B&B Triplewall Containers Ltd Hits New 52-Week High of Rs 238 on Back of Strong Technical Signals
Surging past its previous peak, B&B Triplewall Containers Ltd reached a fresh 52-week high of Rs 238 on 09 Jun 2026, marking a significant milestone in its price momentum. This rally has been fuelled by a confluence of bullish technical indicators and sustained buying interest, setting the stock apart in a market environment where the broader Sensex remains subdued.
Read full news article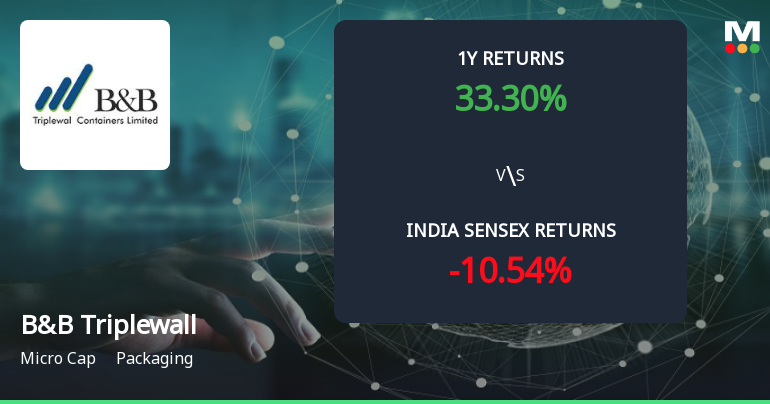
B&B Triplewall Containers Ltd Forms Golden Cross Amid Mixed Technical Signals
The 50-day moving average has crossed above the 200-day moving average for B&B Triplewall Containers Ltd, signalling a golden cross on 8 Jun 2026. Yet, the broader technical picture is nuanced, with weekly indicators largely bullish but monthly momentum showing mild bearishness. This divergence raises questions about the strength of the signal and its implications for the stock’s trajectory.
Read full news article Announcements
Announcement under Regulation 30 (LODR)-Newspaper Publication
31-May-2026 | Source : BSENewspaper Advertisement of Audited Financial Results for the quarter and financial year ended on March 31 2026
Announcement under Regulation 30 (LODR)-Acquisition
30-May-2026 | Source : BSEDisclosure pursuant to Regulation 30 of SEBI (LODR) Regulation 2015
Board Meeting Outcome for Approval Of Audited Financial Results For The Quarter And Financial Year Ended On March 31 2026
30-May-2026 | Source : BSEOutcome of Board Meeting for approval of Audited Financial Results for the quarter and Year ended March 31 2026
Corporate Actions

No Upcoming Board Meetings

B&B Triplewall Containers Ltd has declared 10% dividend, ex-date: 23 Sep 24

No Splits history available

No Bonus history available

No Rights history available
Quality key factors
Valuation key factors
Technicals key factors
 Technical Indicator Scale: Bearish, Mildly Bearish, Sideways, Mildly Bullish, Bullish Turned
 Shareholding Snapshot : Mar 2026
Shareholding Compare (%holding)
Promoters
None
Held by 0 Schemes
Held by 0 FIIs
Alka Gupta (11.68%)
Binjusaria Papers Pvt Ltd (4.25%)
18.34%
Quarterly Results Snapshot (Consolidated) - Mar'26 - QoQ

QoQ Growth in quarter ended Mar 2026 is 4.45% vs 6.22% in Dec 2025

QoQ Growth in quarter ended Mar 2026 is 84.01% vs 5.78% in Dec 2025
Half Yearly Results Snapshot (Consolidated) - Sep'25
Growth in half year ended Sep 2025 is 31.68% vs 25.30% in Sep 2024
Growth in half year ended Sep 2025 is 127.15% vs -70.21% in Sep 2024
Nine Monthly Results Snapshot (Consolidated) - Dec'25
YoY Growth in nine months ended Dec 2025 is 29.65% vs 28.50% in Dec 2024
YoY Growth in nine months ended Dec 2025 is 412.16% vs -127.67% in Dec 2024
Annual Results Snapshot (Consolidated) - Mar'26
YoY Growth in year ended Mar 2026 is 25.34% vs 31.00% in Mar 2025
YoY Growth in year ended Mar 2026 is 473.24% vs -133.64% in Mar 2025
About B&B Triplewall Containers Ltd

Company Coordinates


