
Dashboard
High Management Efficiency with a high ROCE of 17.29%
Healthy long term growth as Net Sales has grown by an annual rate of 14.61%
The company has declared Positive results for the last 4 consecutive quarters
With ROCE of 24.8, it has a Very Attractive valuation with a 1.2 Enterprise value to Capital Employed
High Institutional Holdings at 38.53%
Total Returns (Price + Dividend) 
Latest dividend: 10 per share ex-dividend date: Feb-02-2026
Risk Adjusted Returns v/s
Returns Beta

News
Bharat Petroleum Sees Significant Open Interest Surge Amid Mixed Market Signals
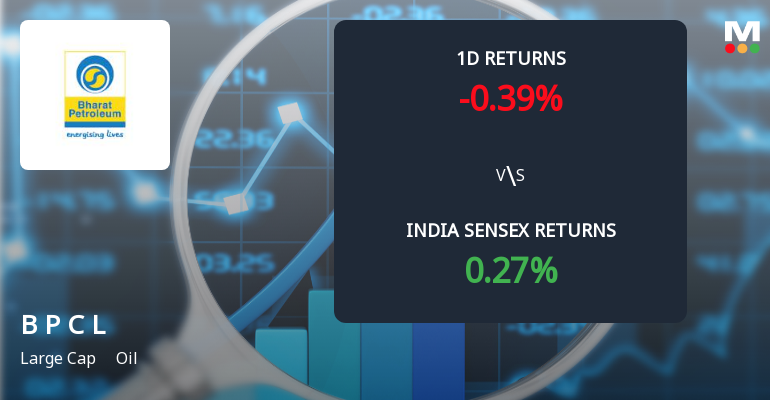
Bharat Petroleum Corporation Ltd (BPCL) has witnessed a notable 11.57% increase in open interest in its derivatives segment, signalling heightened market activity and shifting investor positioning. Despite this surge, the stock underperformed its sector and the broader Sensex, reflecting a complex interplay of bullish and bearish sentiments among traders.
Read full news articleAre Bharat Petroleum Corporation Ltd latest results good or bad?
Bharat Petroleum Corporation Ltd (BPCL) has reported its financial results for the quarter ending March 2026, revealing a mixed operational performance. The consolidated net profit stood at ₹5,624.54 crores, reflecting a year-on-year growth of 28.07%, indicating the company's ability to leverage favorable refining margins compared to the same period last year. However, there was a significant sequential decline of 21.76% from the previous quarter, raising concerns about emerging margin pressures. Net sales for the quarter were reported at ₹1,18,700.88 crores, which represents a marginal decrease of 0.28% from the prior quarter, although it shows a year-on-year increase of 6.72%. This suggests that while BPCL has maintained sales momentum compared to last year, the quarter-on-quarter performance indicates a slight contraction. The operating margin, excluding other income, was recorded at 8.49%, which is a ...
Read full news article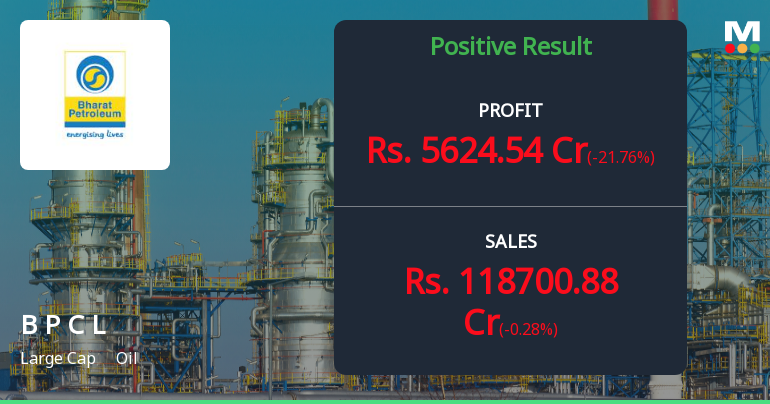
BPCL Q4 FY26: Strong Profit Growth Masks Margin Compression Concerns
Bharat Petroleum Corporation Ltd. (BPCL) reported consolidated net profit of ₹5,624.54 crores for Q4 FY26, reflecting a robust 28.07% year-on-year growth, though the quarter witnessed a sequential decline of 21.76% from Q3 FY26's ₹7,188.40 crores. The state-owned oil refining and marketing giant, with a market capitalisation of ₹1,23,539 crores, delivered net sales of ₹1,18,700.88 crores during the quarter, marking a marginal 0.28% sequential decline but a healthy 6.72% increase over the year-ago period.
Read full news article Announcements
Bharat Petroleum Corporation Limited - Reply to Clarification Sought
09-Dec-2019 | Source : NSEBharat Petroleum Corporation Limitedration Limited with respect to announcement dated 28-Nov-2019, regarding Strike by BPCL workmen. On basis of above the Company was required to clarify following: 1. Expected quantum of loss/damage caused; 2. Estimated impact on the production/operations in case of strikes/lock outs; 3. Factory/unit where the strike/lock out takes place including reasons for such strike. The response of the Company is attached.
Bharat Petroleum Corporation Limited - Clarification
05-Dec-2019 | Source : NSEBharat Petroleum Corporation Limited with respect to announcement dated 28-Nov-2019, regarding Strike by BPCL workmen. On basis of above the Company is required to clarify following: 1. Expected quantum of loss/damage caused;
Bharat Petroleum Corporation Limited - Change in Director(s)
03-Dec-2019 | Source : NSEBharat Petroleum Corporation Limited has informed the Exchange regarding Change in Director(s) of the company.
Corporate Actions

No Upcoming Board Meetings

Bharat Petroleum Corporation Ltd has declared 100% dividend, ex-date: 02 Feb 26

No Splits history available

Bharat Petroleum Corporation Ltd has announced 1:1 bonus issue, ex-date: 21 Jun 24

No Rights history available
Quality key factors
Valuation key factors
Technicals key factors
 Technical Indicator Scale: Bearish, Mildly Bearish, Sideways, Mildly Bullish, Bullish Turned
 Shareholding Snapshot : Mar 2026
Shareholding Compare (%holding)
Promoters
None
Held by 41 Schemes (8.14%)
Held by 892 FIIs (19.58%)
President Of India (52.98%)
Lici Ulip-growth Fund (6.78%)
5.75%
Quarterly Results Snapshot (Consolidated) - Mar'26 - QoQ

QoQ Growth in quarter ended Mar 2026 is -0.28% vs 13.42% in Dec 2025
QoQ Growth in quarter ended Mar 2026 is -21.76% vs 16.10% in Dec 2025
Half Yearly Results Snapshot (Consolidated) - Sep'25

Growth in half year ended Sep 2025 is 0.75% vs -0.07% in Sep 2024
Growth in half year ended Sep 2025 is 153.57% vs -72.79% in Sep 2024
Nine Monthly Results Snapshot (Consolidated) - Dec'25
YoY Growth in nine months ended Dec 2025 is 2.27% vs -0.75% in Dec 2024
YoY Growth in nine months ended Dec 2025 is 126.04% vs -59.47% in Dec 2024
Annual Results Snapshot (Consolidated) - Mar'26
YoY Growth in year ended Mar 2026 is 3.40% vs -1.74% in Mar 2025
YoY Growth in year ended Mar 2026 is 93.78% vs -50.35% in Mar 2025
About Bharat Petroleum Corporation Ltd

Company Coordinates


