
Compare Baazar Style with Similar Stocks
Stock DNA
Garments & Apparels
INR 2,312 Cr (Small Cap)
88.00
NA
0.00%
2.18
6.17%
5.41
Total Returns (Price + Dividend) 
Baazar Style for the last several years.
Risk Adjusted Returns v/s
Returns Beta

News

Baazar Style Retail Ltd is Rated Sell
Baazar Style Retail Ltd is rated Sell by MarketsMOJO, with this rating last updated on 29 May 2026. However, the analysis and financial metrics presented here reflect the stock’s current position as of 23 June 2026, providing investors with the most up-to-date insight into the company’s performance and outlook.
Read full news article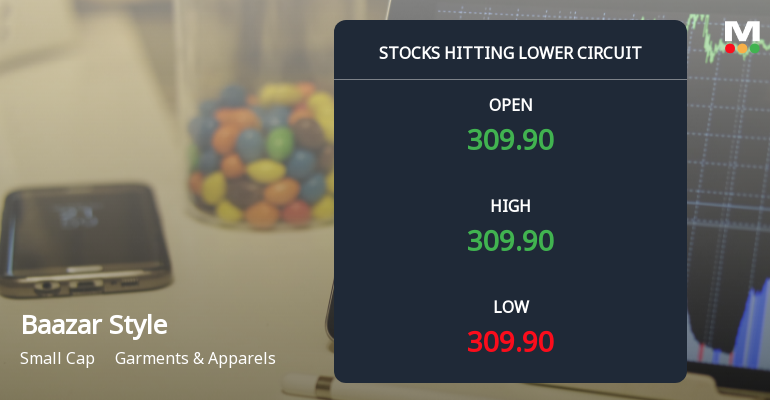
Baazar Style Retail Ltd Locks at Lower Circuit With 5% Loss — Sellers Queue, No Buyers in Sight
At Rs 310.10, sellers were still queuing — but there were no buyers willing to take the other side. Baazar Style Retail Ltd locked at its lower circuit of 5% on 23 Jun 2026, with unfilled sell orders and a frozen price.
Read full news article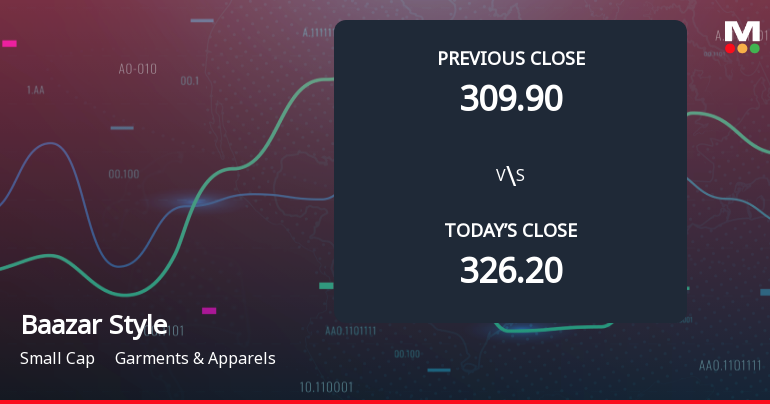
Announcements
Announcement under Regulation 30 (LODR)-Newspaper Publication
20-Jun-2026 | Source : BSEPlease find enclosed herewith copies of newspaper publication for Postal Ballot Notice.
Shareholder Meeting / Postal Ballot-Notice of Postal Ballot
19-Jun-2026 | Source : BSEPursuant to Regulation 30 of the Securities and Exchange Board of India (Listing Obligations and Disclosure Requirements) Regulations 2015 please find enclosed Notice of Postal Ballot .
Intimation Regarding Postal Ballot Process And Issuance Of Postal Ballot Notice
16-Jun-2026 | Source : BSEPursuant to Regulation 30 of the SEBI (Listing Obligations and Disclosure Requirements) Regulations 2015 read with the applicable provisions of the Companies Act 2013 and the rules made thereunder as amended from time to time we wish to inform you that the Company is initiating a postal Ballot process through remote e-voting for seeking approval of the Members in respect of the following special businesses as annexed herewith.
Corporate Actions

No Upcoming Board Meetings

No Dividend history available

No Splits history available

No Bonus history available

No Rights history available
Quality key factors
Valuation key factors
Technicals key factors
 Technical Indicator Scale: Bearish, Mildly Bearish, Sideways, Mildly Bullish, Bullish Turned
 Shareholding Snapshot : May 2026
Shareholding Compare (%holding)
Non Institution
None
Held by 2 Schemes (4.36%)
Held by 13 FIIs (1.3%)
Rohit Kedia (5.86%)
Dinesh Agarwal (huf) (4.04%)
25.85%
Quarterly Results Snapshot (Consolidated) - Mar'26 - QoQ

QoQ Growth in quarter ended Mar 2026 is -0.17% vs -12.26% in Dec 2025

QoQ Growth in quarter ended Mar 2026 is -235.28% vs -63.18% in Dec 2025
Half Yearly Results Snapshot (Consolidated) - Sep'25
Growth in half year ended Sep 2025 is 55.02% vs 41.00% in Sep 2024
Growth in half year ended Sep 2025 is 672.12% vs 5.93% in Sep 2024
Nine Monthly Results Snapshot (Consolidated) - Dec'25
YoY Growth in nine months ended Dec 2025 is 37.83% vs 33.22% in Dec 2024
YoY Growth in nine months ended Dec 2025 is 244.30% vs -25.77% in Dec 2024
Annual Results Snapshot (Consolidated) - Mar'26
YoY Growth in year ended Mar 2026 is 37.01% vs 38.12% in Mar 2025
YoY Growth in year ended Mar 2026 is 219.71% vs -33.18% in Mar 2025
About Baazar Style Retail Ltd

Company Coordinates


