Bajaj Hindusthan

INR
22.10
-0.37 (-1.65%)
BSENSE

Sep 01, 10:34 AM

BSE+NSE Vol: 1.23 cr

  • Price Points
  • Score
  • Mojo Parameters
  • Total Return
  • News and Corporate Actions
  • Key factors
  • Shareholding
  • Financials
  • CompanyCV
stock-summaryPrice Point
High/Low

1Day

52 Week

Valuation
Technical
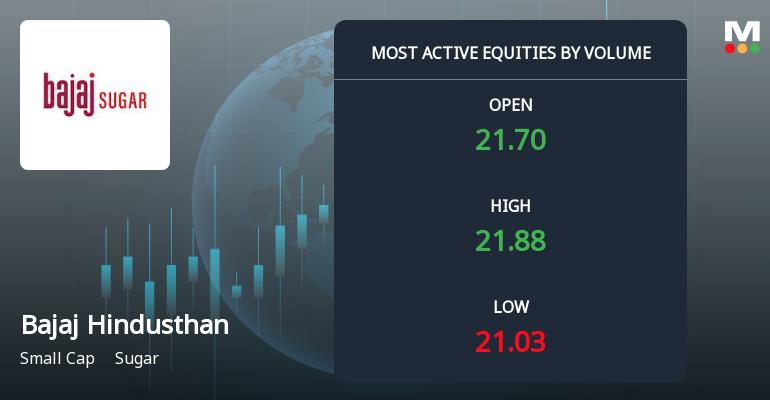
Day's Volume

CASH

1.23 cr (-60.38%) Volume

Shareholding (Jun 2026)

FII

1.14%

Held by 44 FIIs

DII

50.68%

Held by 128 DIIs

Promoter

13.33%

Why is Bajaj Hindusthan Sugar Ltd falling/rising?

01-Sep-2026

As of 31-Aug, Bajaj Hindusthan Sugar Ltd's stock price has risen to 22.47, up 3.64% today, driven by sector performance and recent gains. However, the company faces significant challenges, including high debt levels, low profitability, and pledged promoter shares, which could impact its long-term outlook.

As of 31-Aug, Bajaj Hindusthan Sugar Ltd is experiencing a rise in its stock price, currently at 22.47, with a change of 0.79 (3.64%) upward. This increase can be attributed to several factors. Firstly, the stock has outperformed its sector by 0.86% today and has shown a consecutive gain over the last two days, resulting in a total return of 6.29% during this period. Additionally, the sugar sector itself has gained by 3.08%, contributing positively to the stock's performance.<BR><BR>Despite these positive movements, it is important to note that the stock has had a mixed performance over different time frames. For instance, it has seen a significant increase of 33.99% over the past month, contrasting with a decline of 7.34% over the past week. Furthermore, while the stock is currently trading above its 20-day, 50-day, 100-day, and 200-day moving averages, it is below its 5-day moving average, indicating some volatility.<BR><BR>However, the company faces challenges that could impact its long-term performance. It has reported operating losses and has a high Debt to EBITDA ratio of 9.70 times, indicating a low ability to service its debt. Additionally, the company has a low Return on Equity (ROE) of 0.74%, suggesting weak profitability. The recent financial results show a significant drop in profit before tax and a decline in net sales, which could raise concerns among investors.<BR><BR>Moreover, the fact that 100% of promoter shares are pledged adds a layer of risk, particularly in falling markets, as it may exert downward pressure on the stock price. Overall, while the stock is currently rising, its long-term fundamentals and market conditions present a complex picture.

View full answer

Who are in the management team of Bajaj Hindusthan?

01-Sep-2026

The management team of Bajaj Hindusthan includes Kushagra Bajaj (Chairman), Ajay Kumar Sharma (Managing Director), and several independent directors, along with nominees from SBI and PNB, and the Company Secretary Kausik Adhikari. They are responsible for the company's strategic direction and governance.

The management team of Bajaj Hindusthan includes the following key individuals:<BR><BR>1. **Kushagra Bajaj** - Chairman (Non-Executive)<BR>2. **Ajay Kumar Sharma** - Managing Director<BR>3. **D K Shukla** - Independent Director<BR>4. **Shalu Bhandari** - Independent Director<BR>5. **Atul Mehta** - Independent Director<BR>6. **Vinod Chandulal Sampat** - Independent Director<BR>7. **Ashok Mukand** - Nominee (SBI)<BR>8. **Ramani Ranjan Mishra** - Nominee (PNB)<BR>9. **Kausik Adhikari** - Company Secretary & Compliance Officer<BR><BR>This team plays a crucial role in guiding the company's strategic direction and governance.

View full answer

What does Bajaj Hindusthan do?

01-Sep-2026

Bajaj Hindusthan Sugar Ltd is a leading Indian sugar and ethanol manufacturer, incorporated in 1931. As of June 2026, it reported net sales of ₹1,126 Cr and a net loss of ₹185 Cr, with a market cap of ₹5,097 Cr.

Overview:<BR>Bajaj Hindusthan Sugar Ltd is India's leading sugar and ethanol manufacturing company operating in the small-cap segment of the sugar industry.<BR><BR>History:<BR>Bajaj Hindusthan Sugar Ltd was incorporated on November 24, 1931, originally as Bajaj Hindusthan Limited, and underwent a name change to its current title on January 30, 2015. The latest quarterly results reported net sales and net profit for June 2026.<BR><BR>Financial Snapshot:<BR>Net Sales: 1,126 Cr (Quarterly Results - Jun 2026) <BR>Net Profit: -185 Cr (Quarterly Results - Jun 2026) <BR>Market Cap: INR 5,097 Cr (Small Cap)<BR><BR>Key Metrics:<BR>P/E: 41.00 <BR>Industry P/E: 23 <BR>Dividend Yield: 0.00% <BR>Debt-Equity: 0.91 <BR>Return on Equity: 3.69% <BR>Price to Book: 1.36 <BR><BR>Contact Details:<BR>Address: Golagokarannath, Lakhimpur-Kheri Kheri Uttar Pradesh : 262802 <BR>Tel: 91-5876-233754/5/7/8/233403 <BR>Email: investor.complaints@bajajhindusthan <BR>Website: http://www.bajajhindusthan.com

View full answer

Who are the peers of the Bajaj Hindusthan?

01-Sep-2026

Bajaj Hindusthan's peers include Balrampur Chini, Piccadily Agro, Triven. Engg. Ind., Sh. Renuka Sugar, Bannari Amm. Sug., Dalmia Bharat, Avadh Sugar, Uttam Sug. Mills, Dhampur Sugar, and Dwarikesh Sugar. It has below average management risk and capital structure, with a 1-year return of 11.35%, higher than Sh. Renuka Sugar but lower than Avadh Sugar's 108.16%.

Peers: The peers of Bajaj Hindusthan are Balrampur Chini, Piccadily Agro, Triven.Engg.Ind., Sh.Renuka Sugar, Bannari Amm.Sug., Dalmia Bharat, Avadh Sugar, Uttam Sug.Mills, Dhampur Sugar, and Dwarikesh Sugar.<BR><BR>Quality Snapshot: Excellent management risk is observed at Balrampur Chini and Triven.Engg.Ind., while Average management risk is found at Piccadily Agro, Bannari Amm.Sug., Dalmia Bharat, Avadh Sugar, Uttam Sug.Mills, Dhampur Sugar, and Dwarikesh Sugar. Below Average management risk is noted for Sh.Renuka Sugar and Bajaj Hindusthan. Growth is Good at Piccadily Agro and Bajaj Hindusthan, while Below Average growth is seen in Balrampur Chini, Triven.Engg.Ind., Sh.Renuka Sugar, Bannari Amm.Sug., Dalmia Bharat, Avadh Sugar, Uttam Sug.Mills, Dhampur Sugar, and Dwarikesh Sugar. Capital Structure is rated Good for Piccadily Agro, Bannari Amm.Sug., and Dalmia Bharat, while Average capital structure is observed at Triven.Engg.Ind. and Dwarikesh Sugar, and Below Average at Balrampur Chini, Sh.Renuka Sugar, Bajaj Hindusthan, Avadh Sugar, Uttam Sug.Mills, and Dhampur Sugar.<BR><BR>Return Snapshot: The peer with the highest 1-year return is Avadh Sugar at 108.16%, while the lowest is Sh.Renuka Sugar at -12.17%. Bajaj Hindusthan's 1-year return of 11.35% is higher than Sh.Renuka Sugar's but lower than Avadh Sugar's. Additionally, Sh.Renuka Sugar is the only peer with a negative six-month return.

View full answer

How big is Bajaj Hindusthan?

01-Sep-2026

As of 31st August, Bajaj Hindusthan Sugar Ltd has a market capitalization of 5,097.00 Cr, with recent Net Sales of 5,332.31 Cr and a Net Profit of 115.68 Cr. The company has Shareholder's Funds of 3,810.72 Cr and Total Assets of 14,303.79 Cr as of March 2026.

As of 31st August, Bajaj Hindusthan Sugar Ltd has a market capitalization of 5,097.00 Cr, categorizing it as a Small Cap company.<BR><BR>In the latest four quarters, Bajaj Hindusthan reported Net Sales of 5,332.31 Cr and a Net Profit of 115.68 Cr.<BR><BR>For the latest annual period ending March 2026, the company has Shareholder's Funds amounting to 3,810.72 Cr and Total Assets of 14,303.79 Cr.

View full answer

Should I buy, sell or hold Bajaj Hindusthan Sugar Ltd?

20-Aug-2026

Are Bajaj Hindusthan Sugar Ltd latest results good or bad?

03-Jun-2026

Bajaj Hindusthan Sugar Ltd's latest Q4 FY26 results show strong growth, with net sales up 20.88% and a net profit increase of 77.37%. However, concerns remain due to a negative five-year sales growth rate, low return on equity, and a high debt-to-EBITDA ratio, indicating potential long-term challenges despite the positive quarterly performance.

Bajaj Hindusthan Sugar Ltd's latest results for Q4 FY26 show a significant recovery, with net sales increasing by 20.88% sequentially to ₹1,668.71 crores and a remarkable net profit of ₹390.72 crores, reflecting a 77.37% year-on-year growth. The operating margin also expanded dramatically to 22.37%, up from just 5.29% in the previous quarter. This improvement is largely attributed to seasonal strength in sugar prices and enhanced operational efficiency.<BR><BR>However, despite this strong quarterly performance, the broader financial picture raises concerns. The company has a five-year sales growth rate of -3.93% and a return on equity (ROE) of only 0.74%, indicating poor capital efficiency. Additionally, the debt-to-EBITDA ratio is alarmingly high at 23.90 times, suggesting significant financial strain.<BR><BR>While the recent results are positive, they may not signal a sustainable turnaround given the company's history of volatility and structural challenges in the sugar sector. The reliance on cyclical sugar pricing and the burden of debt remain critical issues. Therefore, while the quarterly results are good in isolation, the overall outlook for Bajaj Hindusthan Sugar Ltd is mixed, with substantial risks that investors should consider.

View full answer

When is the next results date for Bajaj Hindusthan Sugar Ltd?

21-May-2026

Bajaj Hindusthan Sugar Ltd will announce its results on 29 May 2026.

Bajaj Hindusthan Sugar Ltd is scheduled to declare its results on 29 May 2026.

View full answer

Is Bajaj Hindusthan technically bullish or bearish?

04-Dec-2025

As of December 3, 2025, Bajaj Hindusthan's technical trend is bearish, supported by negative signals from MACD, Bollinger Bands, and daily moving averages, despite some mixed indicators on the KST and OBV.

As of 3 December 2025, the technical trend for Bajaj Hindusthan has changed from mildly bearish to bearish. The current technical stance is bearish with a strong indication from the weekly and monthly MACD, both showing bearish signals. The Bollinger Bands also confirm a bearish outlook on both time frames. Daily moving averages are bearish, reinforcing the negative sentiment. Although the KST is mildly bullish on the weekly chart, it is bearish on the monthly, suggesting a lack of strong upward momentum. The Dow Theory indicates a mildly bearish stance on the weekly and mildly bullish on the monthly, which adds some complexity but does not override the overall bearish trend. The OBV shows a mildly bearish trend on the weekly but bullish on the monthly, indicating some divergence in volume trends. Overall, the bearish indicators dominate, suggesting a weak technical position for Bajaj Hindusthan.

View full answer

Is Bajaj Hindusthan overvalued or undervalued?

14-Nov-2025

As of November 13, 2025, Bajaj Hindusthan is considered risky and overvalued with a PE ratio of -16.55, an EV to EBITDA of 32.97, and a year-to-date return of -30.89%, significantly underperforming compared to its peers and the Sensex.

As of 13 November 2025, the valuation grade for Bajaj Hindusthan has moved from attractive to risky. The company is currently considered overvalued based on its financial metrics. Key ratios include a PE ratio of -16.55, an EV to EBITDA of 32.97, and a Price to Book Value of 0.71. <BR><BR>In comparison to its peers, Bajaj Hindusthan's valuation appears unfavorable; for instance, EID Parry has a PE ratio of 20.68 and Balrampur Chini stands at 22.8, both indicating a more favorable valuation. Additionally, Bajaj Hindusthan's recent stock performance has lagged significantly behind the Sensex, with a year-to-date return of -30.89% compared to the Sensex's 8.11%.

View full answer

How has been the historical performance of Bajaj Hindusthan?

13-Nov-2025

Bajaj Hindusthan has experienced a decline in net sales and profitability from Mar'23 to Mar'25, with net sales dropping from 6,338.03 Cr to 5,574.76 Cr, despite a slight improvement in operating profit. The company continues to report losses and faces challenges in cash generation, indicating ongoing financial difficulties.

Answer:<BR>The historical performance of Bajaj Hindusthan shows a fluctuating trend in its financial metrics over the years, with a notable decline in net sales and profitability.<BR><BR>Breakdown:<BR>Bajaj Hindusthan's net sales have decreased from 6,338.03 Cr in Mar'23 to 5,574.76 Cr in Mar'25, reflecting a downward trend. The total operating income followed a similar pattern, dropping from 6,338.03 Cr in Mar'23 to 5,574.76 Cr in Mar'25. Raw material costs also decreased, from 5,074.48 Cr in Mar'23 to 4,361.03 Cr in Mar'25, while total expenditure excluding depreciation fell from 6,075.18 Cr in Mar'23 to 5,285.02 Cr in Mar'25. Operating profit, which was 262.85 Cr in Mar'23, increased to 289.74 Cr in Mar'25, indicating a slight recovery in operational efficiency. However, the company has consistently reported losses, with profit before tax improving from -138.16 Cr in Mar'23 to -10.67 Cr in Mar'25, and profit after tax also showing a similar trend from -134.74 Cr in Mar'23 to -15.44 Cr in Mar'25. The total liabilities decreased from 15,939.34 Cr in Mar'23 to 15,284.37 Cr in Mar'25, while total assets also declined from 15,939.34 Cr to 15,284.37 Cr in the same period. Cash flow from operating activities decreased from 792.00 Cr in Mar'23 to 280.00 Cr in Mar'25, reflecting challenges in cash generation. Overall, while there are signs of operational improvement, the company continues to face significant financial challenges.

View full answer

Who are the top shareholders of the Bajaj Hindusthan?

06-Jun-2025

The top shareholders of Bajaj Hindusthan include Kushagra Bajaj with 7.52%, Life Insurance Corporation of India at 3.21%, and individual investors holding 53.94%. Promoter holdings are fully pledged at 100%, with mutual funds and foreign institutional investors holding 0.2% and 2.61%, respectively.

The top shareholders of Bajaj Hindusthan include a mix of institutional and individual investors. The largest promoter is Kushagra Bajaj, who holds 7.52% of the shares. The highest public shareholder is the Life Insurance Corporation of India, with a stake of 3.21%. Additionally, individual investors collectively hold a significant portion of 53.94%. <BR><BR>In terms of institutional holdings, the company has 7 mutual fund schemes that hold 0.2% of the shares, and 47 foreign institutional investors (FIIs) with a combined holding of 2.61%. It's also noteworthy that the promoter holdings are fully pledged at 100%.

View full answer

Has Bajaj Hindusthan declared dividend?

06-Jun-2025

Bajaj Hindusthan has declared a 10% dividend, amounting to 0.1 per share, but the dividend yield is 0%. Total returns have varied significantly, with strong positive returns over longer periods despite negative returns in the short term.

Bajaj Hindusthan has declared a 10% dividend.<BR><BR>Dividend Details:<BR>- Percentage announced: 10%<BR>- Amount per share: 0.1<BR>- Ex-date: 31 Jan 13<BR><BR>Dividend Yield: 0%<BR><BR>Total Returns by Period:<BR>In the 6-month period, the price return was -28.5%, the dividend return was 0%, resulting in a total return of -28.5%.<BR><BR>For the 1-year period, the price return was -25.19%, the dividend return was 0%, leading to a total return of -25.19%.<BR><BR>Over the 2-year period, the price return was 62.83%, the dividend return was 0%, which resulted in a total return of 62.83%.<BR><BR>In the 3-year period, the price return was 65.5%, the dividend return was 0%, culminating in a total return of 65.5%.<BR><BR>For the 4-year period, the price return was 96.91%, the dividend return was 0%, resulting in a total return of 96.91%.<BR><BR>In the 5-year period, the price return was 351.12%, the dividend return was 0%, leading to a total return of 351.12%.<BR><BR>Overall, Bajaj Hindusthan has declared a dividend, but the dividend yield remains at 0%. The total returns over various periods show significant variability, with strong positive returns over longer periods despite negative returns in the short term.

View full answer
iScoreScore
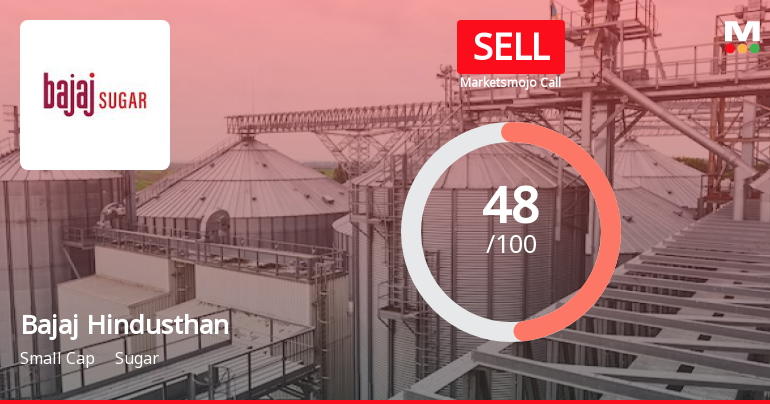
Click here to find our call on this stock
Strong Sell
Sell
Hold
Buy
Strong Buy

Dashboard

1

With a Operating Losses, the company has a Weak Long Term Fundamental Strength

  • Low ability to service debt as the company has a high Debt to EBITDA ratio of 9.70 times
  • The company has been able to generate a Return on Equity (avg) of 0.74% signifying low profitability per unit of shareholders funds
2

Flat results in Jun 26

3

With ROCE of 2.1, it has a Expensive valuation with a 1.2 Enterprise value to Capital Employed

4

100% of Promoter Shares are Pledged

stock-summaryMojo Parameters

Mojo Parameters

Loading Valuation Snapshot...

Stock DNA

stock-summary
Industry

Sugar

stock-summary
Market cap

INR 5,283 Cr (Small Cap)

stock-summary
P/E

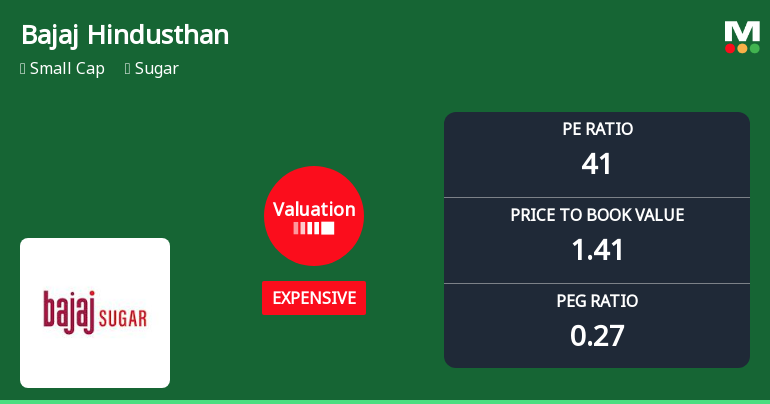
41.00

stock-summary
Industry P/E

23

stock-summary
Dividend Yield

0.00%

stock-summary
Debt Equity

0.91

stock-summary
Return on Equity

3.69%

stock-summary
Price to Book

1.41

Revenue and Profits:
Net Sales:
1,126 Cr
(Quarterly Results - Jun 2026)
Net Profit:
-185 Cr
stock-summaryTotal Returns
Total Returns (Price + Dividend) stock-summary
Dividend Yield (0%)
TimePeriod
Price Return
Dividend Return
Total Return
3 Months
16.07%
0%
16.07%
6 Months
36.76%
0%
36.76%
1 Year
8.76%
0%
8.76%
2 Years
-48.18%
0%
-48.18%
3 Years
-11.95%
0%
-11.95%
4 Years
119.9%
0%
119.9%
5 Years
53.47%
0%
53.47%

Latest dividend: 0.1 per share ex-dividend date: Jan-31-2013

Risk Adjusted Returns v/s stock-summary
Returns Beta
Icon
Beta has not been calculated since enough price history is not available
stock-summaryNews & Corporate Actions

Announcements stock-summary

Bajaj Hindusthan Sugar Limited - Shareholders meeting

18-Nov-2019 | Source : NSE

Bajaj Hindusthan Sugar Limited has informed the Exchange regarding Notice of Postal Ballot

Bajaj Hindusthan Sugar Limited - Outcome of Board Meeting

13-Nov-2019 | Source : NSE

Bajaj Hindusthan Sugar Limited has informed the Exchange regarding Board meeting held on November 13, 2019 in respect of forthcoming Postal Ballot.

Shareholders meeting

20-Sep-2019 | Source : NSE

Bajaj Hindusthan Sugar Limited has informed the Exchange regarding voting results of Annual General Meeting held on September 20, 2019

Corporate Actions stock-summary

stock-summary
BOARD MEETING

No Upcoming Board Meetings

stock-summary
DIVIDEND

Bajaj Hindusthan Sugar Ltd has declared 10% dividend, ex-date: 31 Jan 13

stock-summary
SPLITS

No Splits history available

stock-summary
BONUS

No Bonus history available

stock-summary
RIGHTS

Bajaj Hindusthan Sugar Ltd has announced 2:1 rights issue, ex-date: 21 Sep 11

stock-summaryKey Factors

Quality key factors stock-summary

Factor
Value
Sales Growth (5y)
-4.42%
EBIT Growth (5y)
25.43%
EBIT to Interest (avg)
0.33
Debt to EBITDA (avg)
23.90
Net Debt to Equity (avg)
0.91
Sales to Capital Employed (avg)
0.77
Tax Ratio
Tax Ratio is Negative%
Dividend Payout Ratio
0
Pledged Shares
100.00%
Institutional Holding
51.81%
ROCE (avg)
0.11%
ROE (avg)
0.74%

Valuation key factors

Factor
Value
P/E Ratio
41
Industry P/E
23
Price to Book Value
1.41
EV to EBIT
161.64
EV to EBITDA
32.37
EV to Capital Employed
1.21
EV to Sales
1.66
PEG Ratio
0.27
Dividend Yield
NA
ROCE (Latest)
2.06%
ROE (Latest)
3.69%

Technicals key factors

Indicator
Weekly
Monthly
MACD
Bullish
Mildly Bullish
RSI
Bearish
No Signal
Bollinger Bands
Bullish
Bullish
Moving Averages
Bullish (Daily)
KST
Bullish
Mildly Bullish
Dow Theory
No Trend
Mildly Bullish
OBV
No Trend
Bullish
stock-summary Technical Indicator Scale: Bearish, Mildly Bearish, Sideways, Mildly Bullish, Bullish  Turned 
stock-summaryShareholding
Shareholding Snapshot : Jun 2026stock-summary
Shareholding Compare (%holding) stock-summary
Majority shareholders

Non Institution

Pledged Promoter Holdings

100

Mutual Funds

Held by 3 Schemes (0.0%)

FIIs

Held by 44 FIIs (1.14%)

Promoter with highest holding

Kushagra Bajaj (4.02%)

Highest Public shareholder

State Bank Of India (11.51%)

Individual Investors Holdings

30.77%

stock-summaryFinancial
[
  {
    "link": "quarterly",
    "btn_text": "All Quarterly Results",
    "header": "Quarterly Results Snapshot (Consolidated) - Jun'26 - YoY",
    "rhs": [
      {
        "prefix": "Net Sales ",
        "suffix": "YoY Growth in quarter ended Jun 2026 is -9.81% vs -9.91% in Jun 2025",
        "dir": 1
      },
      {
        "prefix": "Consolidated Net Profit ",
        "suffix": "YoY Growth in quarter ended Jun 2026 is -6.30% vs -161.32% in Jun 2025",
        "dir": 1
      }
    ],
    "table": {
      "header": [
        "Jun'26",
        "Jun'25",
        "Change(%)"
      ],
      "body": [
        {
          "field": "Net Sales",
          "val1": "1,125.97",
          "val2": "1,248.42",
          "chgp": "-9.81%",
          "chgp_class": "negative"
        },
        {
          "field": "Operating Profit (PBDIT) excl Other Income",
          "val1": "-119.78",
          "val2": "-26.85",
          "chgp": "-346.11%",
          "chgp_class": "negative"
        },
        {
          "field": "Interest",
          "val1": "11.40",
          "val2": "5.52",
          "chgp": "106.52%",
          "chgp_class": "negative"
        },
        {
          "field": "Exceptional Items",
          "val1": "0.00",
          "val2": "-0.14",
          "chgp": "100.00%",
          "chgp_class": "positive"
        },
        {
          "field": "Consolidate Net Profit",
          "val1": "-184.70",
          "val2": "-173.75",
          "chgp": "-6.30%",
          "chgp_class": "negative"
        },
        {
          "field": "Operating Profit Margin (Excl OI)",
          "val1": "-10.64%",
          "val2": "-2.15%",
          "chgp": "-8.49%",
          "chgp_class": "negative"
        }
      ]
    }
  },
  {
    "link": "half-yearly",
    "btn_text": "All Half Yearly Results",
    "header": "Half Yearly Results Snapshot (Consolidated) - Sep'25",
    "rhs": [
      {
        "prefix": "Net Sales ",
        "suffix": " Growth in half year ended Sep 2025 is -5.49% vs 2.08% in Sep 2024",
        "dir": -1
      },
      {
        "prefix": "Consolidated Net Profit ",
        "suffix": " Growth in half year ended Sep 2025 is -96.52% vs 28.15% in Sep 2024",
        "dir": -1
      }
    ],
    "table": {
      "header": [
        "Sep'25",
        "Sep'24",
        "Change(%)"
      ],
      "body": [
        {
          "field": "Net Sales",
          "val1": "2,405.61",
          "val2": "2,545.35",
          "chgp": "-5.49%",
          "chgp_class": "negative"
        },
        {
          "field": "Operating Profit (PBDIT) excl Other Income",
          "val1": "-80.75",
          "val2": "28.63",
          "chgp": "-382.05%",
          "chgp_class": "negative"
        },
        {
          "field": "Interest",
          "val1": "8.06",
          "val2": "55.24",
          "chgp": "-85.41%",
          "chgp_class": "positive"
        },
        {
          "field": "Exceptional Items",
          "val1": "-0.16",
          "val2": "-11.03",
          "chgp": "98.55%",
          "chgp_class": "positive"
        },
        {
          "field": "Consolidate Net Profit",
          "val1": "-278.84",
          "val2": "-141.89",
          "chgp": "-96.52%",
          "chgp_class": "negative"
        },
        {
          "field": "Operating Profit Margin (Excl OI)",
          "val1": "-3.36%",
          "val2": "1.12%",
          "chgp": "-4.48%",
          "chgp_class": "negative"
        }
      ]
    }
  },
  {
    "link": "nine-monthly",
    "btn_text": "All Nine Monthly Results",
    "header": "Nine Monthly Results Snapshot (Consolidated) - Dec'25",
    "rhs": [
      {
        "prefix": "Net Sales ",
        "suffix": "YoY Growth in nine months ended Dec 2025 is -5.85% vs -5.03% in Dec 2024",
        "dir": -1
      },
      {
        "prefix": "Consolidated Net Profit ",
        "suffix": "YoY Growth in nine months ended Dec 2025 is -8.30% vs -37.61% in Dec 2024",
        "dir": 1
      }
    ],
    "table": {
      "header": [
        "Dec'25",
        "Dec'24",
        "Change(%)"
      ],
      "body": [
        {
          "field": "Net Sales",
          "val1": "3,786.05",
          "val2": "4,021.10",
          "chgp": "-5.85%",
          "chgp_class": "negative"
        },
        {
          "field": "Operating Profit (PBDIT) excl Other Income",
          "val1": "-7.71",
          "val2": "4.15",
          "chgp": "-285.78%",
          "chgp_class": "negative"
        },
        {
          "field": "Interest",
          "val1": "14.95",
          "val2": "79.29",
          "chgp": "-81.15%",
          "chgp_class": "positive"
        },
        {
          "field": "Exceptional Items",
          "val1": "-0.16",
          "val2": "-11.75",
          "chgp": "98.64%",
          "chgp_class": "positive"
        },
        {
          "field": "Consolidate Net Profit",
          "val1": "-264.09",
          "val2": "-243.85",
          "chgp": "-8.30%",
          "chgp_class": "negative"
        },
        {
          "field": "Operating Profit Margin (Excl OI)",
          "val1": "-0.20%",
          "val2": "0.10%",
          "chgp": "-0.30%",
          "chgp_class": "negative"
        }
      ]
    }
  },
  {
    "link": "annual",
    "btn_text": "All Annual Results",
    "header": "Annual Results Snapshot (Consolidated) - Mar'26",
    "rhs": [
      {
        "prefix": "Net Sales ",
        "suffix": "YoY Growth in year ended Mar 2026 is -2.15% vs -8.68% in Mar 2025",
        "dir": 1
      },
      {
        "prefix": "Consolidated Net Profit ",
        "suffix": "YoY Growth in year ended Mar 2026 is 637.25% vs 72.72% in Mar 2025",
        "dir": 1
      }
    ],
    "table": {
      "header": [
        "Mar'26",
        "Mar'25",
        "Change(%)"
      ],
      "body": [
        {
          "field": "Net Sales",
          "val1": "5,454.76",
          "val2": "5,574.76",
          "chgp": "-2.15%",
          "chgp_class": "negative"
        },
        {
          "field": "Operating Profit (PBDIT) excl Other Income",
          "val1": "365.62",
          "val2": "289.74",
          "chgp": "26.19%",
          "chgp_class": "positive"
        },
        {
          "field": "Interest",
          "val1": "33.05",
          "val2": "102.90",
          "chgp": "-67.88%",
          "chgp_class": "positive"
        },
        {
          "field": "Exceptional Items",
          "val1": "-14.01",
          "val2": "-9.34",
          "chgp": "-50.00%",
          "chgp_class": "negative"
        },
        {
          "field": "Consolidate Net Profit",
          "val1": "126.63",
          "val2": "-23.57",
          "chgp": "637.25%",
          "chgp_class": "positive"
        },
        {
          "field": "Operating Profit Margin (Excl OI)",
          "val1": "6.70%",
          "val2": "5.20%",
          "chgp": "1.50%",
          "chgp_class": "positive"
        }
      ]
    }
  }
]

Quarterly Results Snapshot (Consolidated) - Jun'26 - YoYstock-summary

Jun'26
Jun'25
Change(%)
Net Sales
1,125.97
1,248.42
-9.81%
Operating Profit (PBDIT) excl Other Income
-119.78
-26.85
-346.11%
Interest
11.40
5.52
106.52%
Exceptional Items
0.00
-0.14
100.00%
Consolidate Net Profit
-184.70
-173.75
-6.30%
Operating Profit Margin (Excl OI)
-10.64%
-2.15%
-8.49%
Values in Rs Cr.
Direction Arrows
Net Sales

YoY Growth in quarter ended Jun 2026 is -9.81% vs -9.91% in Jun 2025

Direction Arrows
Consolidated Net Profit

YoY Growth in quarter ended Jun 2026 is -6.30% vs -161.32% in Jun 2025

Half Yearly Results Snapshot (Consolidated) - Sep'25stock-summary

Sep'25
Sep'24
Change(%)
Net Sales
2,405.61
2,545.35
-5.49%
Operating Profit (PBDIT) excl Other Income
-80.75
28.63
-382.05%
Interest
8.06
55.24
-85.41%
Exceptional Items
-0.16
-11.03
98.55%
Consolidate Net Profit
-278.84
-141.89
-96.52%
Operating Profit Margin (Excl OI)
-3.36%
1.12%
-4.48%
Values in Rs Cr.
Direction Arrows
Net Sales

Growth in half year ended Sep 2025 is -5.49% vs 2.08% in Sep 2024

Direction Arrows
Consolidated Net Profit

Growth in half year ended Sep 2025 is -96.52% vs 28.15% in Sep 2024

Nine Monthly Results Snapshot (Consolidated) - Dec'25stock-summary

Dec'25
Dec'24
Change(%)
Net Sales
3,786.05
4,021.10
-5.85%
Operating Profit (PBDIT) excl Other Income
-7.71
4.15
-285.78%
Interest
14.95
79.29
-81.15%
Exceptional Items
-0.16
-11.75
98.64%
Consolidate Net Profit
-264.09
-243.85
-8.30%
Operating Profit Margin (Excl OI)
-0.20%
0.10%
-0.30%
Values in Rs Cr.
Direction Arrows
Net Sales

YoY Growth in nine months ended Dec 2025 is -5.85% vs -5.03% in Dec 2024

Direction Arrows
Consolidated Net Profit

YoY Growth in nine months ended Dec 2025 is -8.30% vs -37.61% in Dec 2024

Annual Results Snapshot (Consolidated) - Mar'26stock-summary

Mar'26
Mar'25
Change(%)
Net Sales
5,454.76
5,574.76
-2.15%
Operating Profit (PBDIT) excl Other Income
365.62
289.74
26.19%
Interest
33.05
102.90
-67.88%
Exceptional Items
-14.01
-9.34
-50.00%
Consolidate Net Profit
126.63
-23.57
637.25%
Operating Profit Margin (Excl OI)
6.70%
5.20%
1.50%
Values in Rs Cr.
Direction Arrows
Net Sales

YoY Growth in year ended Mar 2026 is -2.15% vs -8.68% in Mar 2025

Direction Arrows
Consolidated Net Profit

YoY Growth in year ended Mar 2026 is 637.25% vs 72.72% in Mar 2025

stock-summaryCompany CV
About Bajaj Hindusthan Sugar Ltd stock-summary
stock-summary
Bajaj Hindusthan Sugar Ltd
Small Cap
Sugar
Bajaj Hindusthan Sugar Limited, a part of the 'Bajaj Group' was formerly established as 'Bajaj Hindusthan Limited' on November 24, 1931, which later on was changed to Bajaj Hindusthan Sugar Limited' effective on January 30, 2015. Bajaj Hindusthan Sugar Limited is India's number one sugar and ethanol manufacturing company, headquartered at Mumbai (Maharashtra), India. The Company has 14 sugar plants, which are all located in Northern State of Uttar Pradesh (UP).
Company Coordinates stock-summary
Company Details
Golagokarannath, Lakhimpur-Kheri Kheri Uttar Pradesh : 262802
stock-summary
Tel: 91-5876-233754/5/7/8/233403
stock-summary
investor.complaints@bajajhindusthan
Registrar Details
Link Intime India Pvt Ltd, C-13 Pannalal Silk Compound, L B S Marg, Bhandup , Mumbai