Bajaj Steel Inds

  • Market Cap: Micro Cap
  • Industry: Industrial Manufacturing
  • ISIN: INE704G01024
  • NSEID: BAJAJST
  • BSEID: 507944
INR
352.10
-0.75 (-0.21%)
BSENSE

Sep 18, 03:30 PM

BSE+NSE Vol: 5.26 k

  • Price Points
  • Score
  • Mojo Parameters
  • Total Return
  • News and Corporate Actions
  • Key factors
  • Shareholding
  • Financials
  • CompanyCV
stock-summaryPrice Point
High/Low

1Day

52 Week

Valuation
Technical
Day's Volume

CASH

5.26 k (-50.60%) Volume

Shareholding (Jun 2026)

FII

0.04%

Held by 1 FIIs

DII

0.01%

Held by 0 DIIs

Promoter

56.62%

Why is Bajaj Steel Industries Ltd falling/rising?

06-Sep-2026

As of 05-Sep, Bajaj Steel Industries Ltd's stock price is at 362.10, with a year-to-date decline of 27.84% and a one-year drop of 32.45%. Despite recent short-term gains, the company's long-term outlook is negative due to declining financial performance and lack of investor confidence.

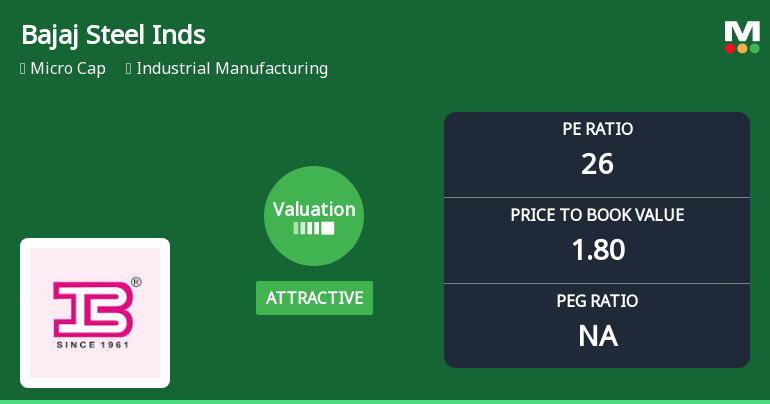
As of 05-Sep, Bajaj Steel Industries Ltd's stock price is currently at 362.10, reflecting a slight decrease of 0.2 (-0.06%). The stock has shown a mixed performance recently, having outperformed its sector by 1.1% today and gaining 3.6% over the last two days. However, it opened the day with a significant loss of 3.39%, reaching an intraday low of Rs 350.<BR><BR>In terms of longer-term performance, the stock has been under pressure, with a year-to-date decline of 27.84% and a one-year drop of 32.45%. This underperformance is stark when compared to the broader market, as the Sensex has only decreased by 10.21% over the same period. The company's financial health is also concerning, with net sales declining at an annual rate of -0.49% and operating profit falling by -18.15% over the last five years. Additionally, the company has reported negative results for the last three consecutive quarters, with significant declines in both profit before tax and profit after tax.<BR><BR>Despite being net-debt free and having an attractive valuation with a price-to-book value of 1.8, the stock is trading at a premium compared to its peers. The lack of domestic mutual fund investment, which stands at 0%, may indicate a lack of confidence in the company's future prospects. Overall, while there are some short-term gains, the long-term outlook remains bleak, contributing to the stock's overall decline.

View full answer

Who are in the management team of Bajaj Steel Inds?

01-Sep-2026

The management team of Bajaj Steel Industries includes Chairman Rohit Bajaj, Executive Directors Sunil Bajaj and M K Sharma Prasad Sharma, along with several Independent Non-Executive Directors and a Company Secretary. This team is responsible for the company's governance and strategic direction.

The management team of Bajaj Steel Industries includes the following key members:<BR><BR>1. **Rohit Bajaj** - Chairman / Executive Director<BR>2. **Sunil Bajaj** - Executive Director<BR>3. **M K Sharma Prasad Sharma** - Executive Director / Whole Time Director<BR>4. **Alok Goenka** - Independent Non-Executive Director<BR>5. **Rajiv Ranka** - Independent Non-Executive Director<BR>6. **Mohan Agrawal** - Independent Non-Executive Director<BR>7. **Raja Iyer** - Independent Non-Executive Director<BR>8. **Deepak Batra** - Independent Non-Executive Director<BR>9. **Bhanupriya N Thakur** - Non-Executive & Non-Independent Director<BR>10. **Rachit Rakesh Jain** - Company Secretary & Compliance Officer<BR><BR>This team plays a crucial role in the governance and strategic direction of the company. If you have any more questions about Bajaj Steel Industries or its operations, feel free to ask!

View full answer

What does Bajaj Steel Inds do?

01-Sep-2026

Bajaj Steel Industries Ltd is an Indian micro-cap company specializing in steel re-rolling and cotton ginning, incorporated in 1961. As of June 2026, it reported net sales of ₹120 Cr and a market cap of ₹737 Cr.

Overview: <BR>Bajaj Steel Industries Ltd is an India-based company engaged in industrial manufacturing, specifically known for its steel re-rolling and cotton ginning activities, categorized as a micro-cap company.<BR><BR>History: <BR>Bajaj Steel Industries Ltd was incorporated on February 14, 1961, as a private limited company and was promoted by Hargovind Bajaj. The company transitioned to a public limited company on October 4, 1985. The latest quarterly results reported net sales and net profit for June 2026.<BR><BR>Financial Snapshot: <BR>Net Sales: 120 Cr (Quarterly Results - Jun 2026) <BR>Net Profit: 0 Cr (Quarterly Results - Jun 2026) <BR>Market Cap: INR 737 Cr (Micro Cap) <BR><BR>Key Metrics: <BR>P/E: 26.00 <BR>Industry P/E: 59 <BR>Dividend Yield: 0.00% <BR>Debt-Equity: -0.12 <BR>Return on Equity: 8.71% <BR>Price to Book: 1.69 <BR><BR>Contact Details: <BR>Address: C-108 MIDC Industrial Area, Hingna Nagpur Maharashtra : 440028 <BR>Tel: 91-712-2720071-80 <BR>Email: cs@bajajngp.com <BR>Website: http://www.bajajngp.com

View full answer

Who are the peers of the Bajaj Steel Inds?

01-Sep-2026

Peers of Bajaj Steel Inds include Rajoo Engineers, Danlaw Tech., Forbes Precision, and others. Bajaj Steel Inds has below-average growth and a 1-year return of -34.97%, better than Rajoo Engineers but worse than Kalyani Cast-Tec, which has the highest return at 91.84%.

Peers: The peers of Bajaj Steel Inds are Rajoo Engineers, Danlaw Tech., Forbes Precision, Indef Manufactur, Kalyani Cast-Tec, Sunita Tools Ltd, Cellecor Gadgets, Sahasra Electro., Z-Tech (India).<BR><BR>Quality Snapshot: Excellent management risk is observed at Kalyani Cast-Tec, while Average management risk is found at Rajoo Engineers, Danlaw Tech., Forbes Precision, Bajaj Steel Inds, Indef Manufactur, Sunita Tools Ltd, Cellecor Gadgets, Z-Tech (India), and OSEL Devices. Good growth is seen at Kalyani Cast-Tec and Sunita Tools Ltd, while Excellent growth is noted at Rajoo Engineers, Danlaw Tech., Cellecor Gadgets, and Z-Tech (India). Below Average growth is present at Bajaj Steel Inds, Forbes Precision, Indef Manufactur, and Sahasra Electro., and the rest. Excellent capital structure is maintained by Rajoo Engineers, Danlaw Tech., Forbes Precision, Bajaj Steel Inds, Indef Manufactur, Kalyani Cast-Tec, Sahasra Electro., and Z-Tech (India), while Good capital structure is seen at Sunita Tools Ltd and OSEL Devices, and Average capital structure is noted at Cellecor Gadgets.<BR><BR>Return Snapshot: Kalyani Cast-Tec has the highest 1-year return at 91.84%, while Rajoo Engineers has the lowest at -52.08%. Bajaj Steel Inds has a 1-year return of -34.97%, which is better than Rajoo Engineers but worse than Kalyani Cast-Tec. Additionally, Indef Manufactur and Sahasra Electro. have negative six-month returns.

View full answer

How big is Bajaj Steel Inds?

01-Sep-2026

As of 31st August, Bajaj Steel Industries Ltd has a market capitalization of 737.00 Cr, with recent net sales of 537.00 Cr and a net profit of 29.24 Cr. Shareholder's funds are 387.42 Cr, and total assets are valued at 603.60 Cr as of March 2025.

As of 31st August, Bajaj Steel Industries Ltd has a market capitalization of 737.00 Cr, categorizing it as a Micro Cap company.<BR><BR>In the latest 4 quarters, Bajaj Steel Industries Ltd reported Net Sales of 537.00 Cr and a Net Profit of 29.24 Cr.<BR><BR>The latest annual period for the balance sheet is March 2025, with Shareholder's Funds amounting to 387.42 Cr and Total Assets valued at 603.60 Cr.

View full answer

Should I buy, sell or hold Bajaj Steel Industries Ltd?

17-Aug-2026

When is the next results date for Bajaj Steel Industries Ltd?

05-Aug-2026

The next results date for Bajaj Steel Industries Ltd is 10 August 2026.

The next results date for Bajaj Steel Industries Ltd is scheduled for 10 August 2026.

View full answer

Are Bajaj Steel Industries Ltd latest results good or bad?

28-May-2026

Bajaj Steel Industries Ltd's latest results are concerning, showing an 87.15% decline in net profit and a 23.93% drop in revenue year-on-year, alongside the lowest operating margin in eight quarters. These indicators suggest significant operational challenges, warranting caution for investors.

The latest results for Bajaj Steel Industries Ltd are concerning and indicate a significant deterioration in performance. In the fourth quarter of FY26, the company reported a net profit of ₹2.32 crore, which is a staggering 87.15% decline year-on-year. Revenue also fell sharply, down 23.93% to ₹116.76 crore compared to the same quarter last year. <BR><BR>Moreover, the operating margin has dropped to 4.81%, the lowest in eight quarters, down from 15.75% in the previous year. This decline reflects severe operational stress and raises questions about the company's pricing power and cost management. The profit after tax margin has also shrunk to just 1.99%, down from 11.77% a year ago.<BR><BR>Overall, these results suggest that Bajaj Steel Industries is facing significant challenges, with collapsing profits, declining revenues, and compressed margins. The company's reliance on other income to support its profits further complicates the outlook, indicating a potential operational crisis. Investors should approach the stock with caution given these troubling indicators.

View full answer

Is Bajaj Steel Inds technically bullish or bearish?

03-Dec-2025

As of December 2, 2025, Bajaj Steel Inds is in a bearish trend, supported by bearish daily moving averages and Bollinger Bands, despite some mixed signals from the MACD and KST.

As of 2 December 2025, the technical trend has changed from mildly bearish to bearish. The current stance is bearish, with a moderate strength indicated by several key factors. The daily moving averages are bearish, and both the weekly and monthly Bollinger Bands confirm a bearish outlook. The MACD shows a mildly bullish signal on the weekly timeframe but is mildly bearish on the monthly, suggesting mixed signals. The KST is also mildly bullish weekly but bearish monthly, further complicating the overall picture. The Dow Theory indicates a mildly bearish stance on the weekly timeframe, while the monthly shows no trend. Overall, the bearish indicators outweigh the mildly bullish signals, leading to a bearish conclusion for Bajaj Steel Inds.

View full answer

How has been the historical performance of Bajaj Steel Inds?

09-Nov-2025

Bajaj Steel Inds has shown consistent growth in net sales and profit, with net sales reaching 584.79 Cr in March 2025, up from 550.96 Cr in March 2024. The company reported an increase in profit before tax to 111.93 Cr and profit after tax to 84.33 Cr in the same period, despite a slight decline in operating profit.

Answer:<BR>The historical performance of Bajaj Steel Inds shows a consistent growth trend in net sales and profit over the years, with a notable increase in the latest fiscal year.<BR><BR>Breakdown:<BR>Bajaj Steel Inds reported net sales of 584.79 Cr in March 2025, up from 550.96 Cr in March 2024 and 549.14 Cr in March 2023, indicating a steady growth trajectory. The total operating income followed a similar pattern, reaching 584.79 Cr in March 2025. The company's operating profit (PBDIT) was 104.54 Cr in March 2025, slightly down from 106.49 Cr in March 2024, but significantly higher than the 65.23 Cr recorded in March 2022. Profit before tax also increased to 111.93 Cr in March 2025 from 79.61 Cr in March 2024, while profit after tax rose to 84.33 Cr from 59.02 Cr in the previous year. The total assets of the company grew to 603.60 Cr in March 2025, compared to 564.16 Cr in March 2024, reflecting a solid asset base. Total liabilities also increased to 603.60 Cr in March 2025 from 564.16 Cr in March 2024, with total debt decreasing to 0.00 Cr in March 2025 from 51.19 Cr in March 2024. Cash flow from operating activities was 52.00 Cr in March 2025, showing a slight decline from 55.00 Cr in March 2024, while net cash outflow was recorded at -11.00 Cr in March 2025, down from a positive inflow of 7.00 Cr in March 2024. Overall, Bajaj Steel Inds has demonstrated resilience and growth in its financial performance over the years.

View full answer

Is Bajaj Steel Inds overvalued or undervalued?

17-Jun-2025

As of June 16, 2025, Bajaj Steel Industries is considered undervalued with a PE ratio of 22.45 and an attractive valuation grade, despite a year-to-date return of -17.78%, indicating potential for growth compared to its peers.

As of 16 June 2025, Bajaj Steel Industries has moved from a fair to an attractive valuation grade. The company appears to be undervalued, with a PE ratio of 22.45, an EV to EBITDA ratio of 15.46, and a ROCE of 21.22%. In comparison to its peers, Bajaj Steel's valuation metrics are significantly more favorable; for instance, LMW has a PE ratio of 169.04 and an EV to EBITDA of 112.29, while Integra Engineering shows a PE of 38.54 and an EV to EBITDA of 23.77.<BR><BR>Despite recent underperformance relative to the Sensex, with a year-to-date return of -17.78% compared to the Sensex's 4.68%, the long-term performance remains strong, with a 3-year return of 447.17%. This indicates that while the short-term outlook may be challenging, the overall valuation suggests that Bajaj Steel Industries is positioned for potential growth, reinforcing its status as undervalued in the current market.

View full answer

Who are the top shareholders of the Bajaj Steel Inds?

06-Jun-2025

The top shareholders of Bajaj Steel Industries include Sidhi Vinimay Private Limited with 15.19%, Bajaj Exports Private Limited with 8.22%, and individual investors holding 30.68%. There are no pledged promoter holdings or mutual funds invested in the company.

The top shareholders of Bajaj Steel Industries include Sidhi Vinimay Private Limited, which holds the highest promoter stake at 15.19%. The highest public shareholder is Bajaj Exports Private Limited, with a holding of 8.22%. Additionally, individual investors collectively own 30.68% of the company. There are also two foreign institutional investors (FIIs) that hold a combined 0.07% of the shares. Notably, there are no pledged promoter holdings and no mutual funds currently invested in the company.

View full answer

What is the bonus history of the Bajaj Steel Inds?

06-Jun-2025

Bajaj Steel Industries Ltd has announced a bonus issue of 3:1, effective November 12, 2024, meaning shareholders will receive three additional shares for every one share held. The record date for this bonus is also November 12, 2024.

Bajaj Steel Industries Ltd has a recent bonus issue with a ratio of 3:1, which is set to take effect on November 12, 2024. This means that for every one share held, shareholders will receive three additional shares. The record date for this bonus issue is also November 12, 2024. If you have any more questions about the company or its financial activities, feel free to ask!

View full answer

Has Bajaj Steel Inds declared dividend?

06-Jun-2025

Yes, Bajaj Steel Industries Ltd has declared a 60% dividend, amounting to ₹3 per share, with an ex-date of August 28, 2024. Despite this declaration, the company has not provided dividend returns in recent periods, although it has shown significant price appreciation over the years.

Bajaj Steel Industries Ltd has declared a 60% dividend.<BR><BR>Dividend Details:<BR>- Percentage announced: 60%<BR>- Amount per share: 3<BR>- Ex-date: 28 Aug 2024<BR><BR>Dividend Yield: 0.1%.<BR><BR>Total Returns by Period:<BR>In the last 6 months, the price return was -16.69%, with no dividend return, resulting in a total return of -16.69%.<BR><BR>Over the past year, the price return was 102.03%, with no dividend return, leading to a total return of 102.03%.<BR><BR>In the 2-year period, the price return was 129.77%, with no dividend return, yielding a total return of 129.77%.<BR><BR>For the 3-year period, the price return was 469.51%, with no dividend return, resulting in a total return of 469.51%.<BR><BR>In the last 4 years, the price return was 396.16%, with no dividend return, leading to a total return of 396.16%.<BR><BR>Over the past 5 years, the price return was 2967.08%, with no dividend return, resulting in a total return of 2967.08%.<BR><BR>Overall, while Bajaj Steel Industries Ltd has declared a dividend, the dividend returns have been non-existent over various periods. However, the company has shown significant price appreciation over the years, indicating strong overall performance despite the lack of dividend returns in the past.

View full answer
iScoreScore
Click here to find our call on this stock
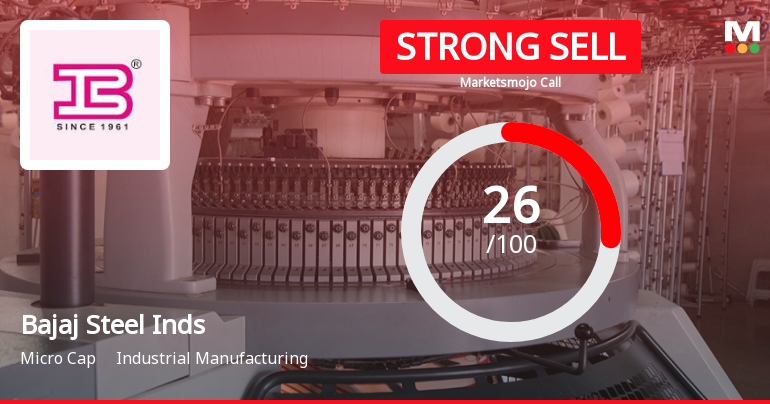
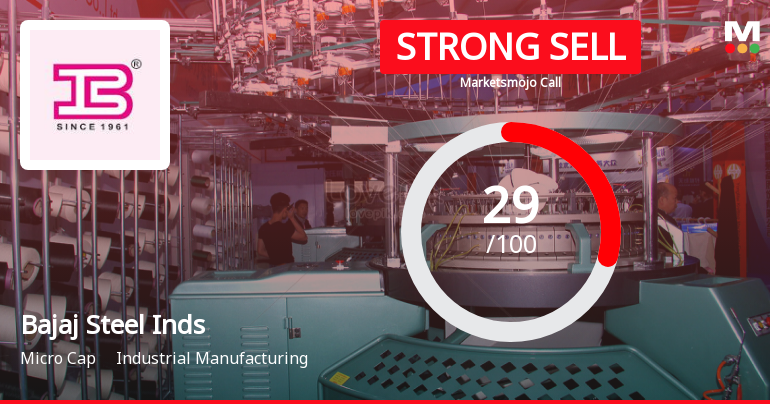
Strong Sell
Sell
Hold
Buy
Strong Buy

Dashboard

1

Poor long term growth as Net Sales has grown by an annual rate of -0.49% and Operating profit at -18.15% over the last 5 years

 
2

The company has declared negative results for the last 3 consecutive quarters

3

Despite the size of the company, domestic mutual funds hold only 0% of the company

4

Underperformed the market in the last 1 year

stock-summaryMojo Parameters

Mojo Parameters

Loading Valuation Snapshot...

Stock DNA

stock-summary
Industry

Industrial Manufacturing

stock-summary
Market cap

INR 746 Cr (Micro Cap)

stock-summary
P/E

25.00

stock-summary
Industry P/E

56

stock-summary
Dividend Yield

0.28%

stock-summary
Debt Equity

-0.12

stock-summary
Return on Equity

8.71%

stock-summary
Price to Book

1.73

Revenue and Profits:
Net Sales:
120 Cr
(Quarterly Results - Jun 2026)
Net Profit:
0 Cr
stock-summaryTotal Returns
Total Returns (Price + Dividend) stock-summary
Dividend Yield (0.28%)
TimePeriod
Price Return
Dividend Return
Total Return
3 Months
-8.33%
0.24%
-8.09%
6 Months
-4.84%
0.28%
-4.56%
1 Year
-40.15%
0.17%
-39.98%
2 Years
-46.26%
0.27%
-45.99%
3 Years
32.12%
1.02%
33.14%
4 Years
118.05%
2.44%
120.49%
5 Years
45.26%
1.91%
47.17%

Latest dividend: 1.0014204545454546 per share ex-dividend date: Sep-16-2026

Risk Adjusted Returns v/s stock-summary
Returns Beta
Icon
Beta has not been calculated since enough price history is not available
stock-summaryNews & Corporate Actions

Announcements stock-summary

Announcement under Regulation 30 (LODR)-Credit Rating

10-Sep-2026 | Source : BSE

Pursuant tp Regulation 30 of SEBI LODR Regulations 2015 Bajaj Steel Industries Limited hereby informs that Crisil ratings Limited vide email dated August 28 2026 communicated the credit ratings for theCompanys Bank Facilities We confirm that there is no material change in credit ratings.

Announcement under Regulation 30 (LODR)-Credit Rating

08-Sep-2026 | Source : BSE

Pursuant to Regulation 30 of SEBI (LODR) Regulations 2015 Bajaj Steel Industries Limited hereby informs that Crisil Ratings Limited vide email dated August 28 2026 has communicated that the revised credit ratings for the Bank Facilities of the Company.

Announcement under Regulation 30 (LODR)-Newspaper Publication

02-Sep-2026 | Source : BSE

Pursuant to the provisions of SEBI Listing Regulations 2015 Please find attached copies of the Newspaper Advertisement Published inter alia for the Notice of 65th Annual General Meeting of the company Remote E-voting Record Date and Book Closure.

Corporate Actions stock-summary

stock-summary
BOARD MEETING

No Upcoming Board Meetings

stock-summary
DIVIDEND

Bajaj Steel Industries Ltd has declared 20% dividend, ex-date: 16 Sep 26

stock-summary
SPLITS

Bajaj Steel Industries Ltd has announced 5:10 stock split, ex-date: 24 Mar 20

stock-summary
BONUS

Bajaj Steel Industries Ltd has announced 3:1 bonus issue, ex-date: 12 Nov 24

stock-summary
RIGHTS

No Rights history available

stock-summaryKey Factors

Quality key factors stock-summary

Factor
Value
Sales Growth (5y)
-0.49%
EBIT Growth (5y)
-18.15%
EBIT to Interest (avg)
10.81
Debt to EBITDA (avg)
0.70
Net Debt to Equity (avg)
-0.12
Sales to Capital Employed (avg)
1.50
Tax Ratio
28.59%
Dividend Payout Ratio
2.47%
Pledged Shares
0
Institutional Holding
0.05%
ROCE (avg)
32.51%
ROE (avg)
16.90%

Valuation key factors

Factor
Value
P/E Ratio
25
Industry P/E
56
Price to Book Value
1.72
EV to EBIT
20.12
EV to EBITDA
12.93
EV to Capital Employed
1.81
EV to Sales
1.27
PEG Ratio
NA
Dividend Yield
0.29%
ROCE (Latest)
11.39%
ROE (Latest)
8.71%

Technicals key factors

Indicator
Weekly
Monthly
MACD
Bearish
Bearish
RSI
Bearish
No Signal
Bollinger Bands
Bearish
Bearish
Moving Averages
Bearish (Daily)
KST
Bearish
Bearish
Dow Theory
Mildly Bullish
No Trend
OBV
No Trend
No Trend
stock-summary Technical Indicator Scale: Bearish, Mildly Bearish, Sideways, Mildly Bullish, Bullish  Turned 
stock-summaryShareholding
Shareholding Snapshot : Jun 2026stock-summary
Shareholding Compare (%holding) stock-summary
Majority shareholders

Promoters

Pledged Promoter Holdings

None

Mutual Funds

Held by 0 Schemes

FIIs

Held by 1 FIIs (0.04%)

Promoter with highest holding

Vidarbha Tradelinks Private Limited (16.39%)

Highest Public shareholder

Bajaj Global Limited (1.88%)

Individual Investors Holdings

30.83%

stock-summaryFinancial
[
  {
    "link": "quarterly",
    "btn_text": "All Quarterly Results",
    "header": "Quarterly Results Snapshot (Consolidated) - Jun'26 - YoY",
    "rhs": [
      {
        "prefix": "Net Sales ",
        "suffix": "YoY Growth in quarter ended Jun 2026 is 11.92% vs -23.74% in Jun 2025",
        "dir": 1
      },
      {
        "prefix": "Consolidated Net Profit ",
        "suffix": "YoY Growth in quarter ended Jun 2026 is -103.65% vs -78.94% in Jun 2025",
        "dir": -1
      }
    ],
    "table": {
      "header": [
        "Jun'26",
        "Jun'25",
        "Change(%)"
      ],
      "body": [
        {
          "field": "Net Sales",
          "val1": "120.35",
          "val2": "107.53",
          "chgp": "11.92%",
          "chgp_class": "positive"
        },
        {
          "field": "Operating Profit (PBDIT) excl Other Income",
          "val1": "5.89",
          "val2": "13.54",
          "chgp": "-56.50%",
          "chgp_class": "negative"
        },
        {
          "field": "Interest",
          "val1": "1.49",
          "val2": "1.29",
          "chgp": "15.50%",
          "chgp_class": "negative"
        },
        {
          "field": "Exceptional Items",
          "val1": "0.00",
          "val2": "0.00",
          "chgp": "",
          "chgp_class": "neutral"
        },
        {
          "field": "Consolidate Net Profit",
          "val1": "-0.27",
          "val2": "7.40",
          "chgp": "-103.65%",
          "chgp_class": "negative"
        },
        {
          "field": "Operating Profit Margin (Excl OI)",
          "val1": "4.89%",
          "val2": "12.59%",
          "chgp": "-7.70%",
          "chgp_class": "negative"
        }
      ]
    }
  },
  {
    "link": "half-yearly",
    "btn_text": "All Half Yearly Results",
    "header": "Half Yearly Results Snapshot (Consolidated) - Sep'25",
    "rhs": [
      {
        "prefix": "Net Sales ",
        "suffix": " Growth in half year ended Sep 2025 is -3.78% vs 16.73% in Sep 2024",
        "dir": -1
      },
      {
        "prefix": "Consolidated Net Profit ",
        "suffix": " Growth in half year ended Sep 2025 is -45.46% vs 98.00% in Sep 2024",
        "dir": -1
      }
    ],
    "table": {
      "header": [
        "Sep'25",
        "Sep'24",
        "Change(%)"
      ],
      "body": [
        {
          "field": "Net Sales",
          "val1": "282.15",
          "val2": "293.24",
          "chgp": "-3.78%",
          "chgp_class": "negative"
        },
        {
          "field": "Operating Profit (PBDIT) excl Other Income",
          "val1": "45.33",
          "val2": "47.15",
          "chgp": "-3.86%",
          "chgp_class": "negative"
        },
        {
          "field": "Interest",
          "val1": "2.62",
          "val2": "1.85",
          "chgp": "41.62%",
          "chgp_class": "negative"
        },
        {
          "field": "Exceptional Items",
          "val1": "0.00",
          "val2": "26.52",
          "chgp": "-100.00%",
          "chgp_class": "negative"
        },
        {
          "field": "Consolidate Net Profit",
          "val1": "28.67",
          "val2": "52.57",
          "chgp": "-45.46%",
          "chgp_class": "negative"
        },
        {
          "field": "Operating Profit Margin (Excl OI)",
          "val1": "16.07%",
          "val2": "16.08%",
          "chgp": "-0.01%",
          "chgp_class": "negative"
        }
      ]
    }
  },
  {
    "link": "nine-monthly",
    "btn_text": "All Nine Monthly Results",
    "header": "Nine Monthly Results Snapshot (Consolidated) - Dec'25",
    "rhs": [
      {
        "prefix": "Net Sales ",
        "suffix": "YoY Growth in nine months ended Dec 2025 is -5.53% vs 14.38% in Dec 2024",
        "dir": -1
      },
      {
        "prefix": "Consolidated Net Profit ",
        "suffix": "YoY Growth in nine months ended Dec 2025 is -47.83% vs 81.09% in Dec 2024",
        "dir": -1
      }
    ],
    "table": {
      "header": [
        "Dec'25",
        "Dec'24",
        "Change(%)"
      ],
      "body": [
        {
          "field": "Net Sales",
          "val1": "407.42",
          "val2": "431.29",
          "chgp": "-5.53%",
          "chgp_class": "negative"
        },
        {
          "field": "Operating Profit (PBDIT) excl Other Income",
          "val1": "54.64",
          "val2": "67.94",
          "chgp": "-19.58%",
          "chgp_class": "negative"
        },
        {
          "field": "Interest",
          "val1": "3.98",
          "val2": "2.79",
          "chgp": "42.65%",
          "chgp_class": "negative"
        },
        {
          "field": "Exceptional Items",
          "val1": "0.00",
          "val2": "26.52",
          "chgp": "-100.00%",
          "chgp_class": "negative"
        },
        {
          "field": "Consolidate Net Profit",
          "val1": "34.58",
          "val2": "66.28",
          "chgp": "-47.83%",
          "chgp_class": "negative"
        },
        {
          "field": "Operating Profit Margin (Excl OI)",
          "val1": "13.41%",
          "val2": "15.75%",
          "chgp": "-2.34%",
          "chgp_class": "negative"
        }
      ]
    }
  },
  {
    "link": "annual",
    "btn_text": "All Annual Results",
    "header": "Annual Results Snapshot (Consolidated) - Mar'26",
    "rhs": [
      {
        "prefix": "Net Sales ",
        "suffix": "YoY Growth in year ended Mar 2026 is -10.36% vs 6.14% in Mar 2025",
        "dir": -1
      },
      {
        "prefix": "Consolidated Net Profit ",
        "suffix": "YoY Growth in year ended Mar 2026 is -56.23% vs 42.88% in Mar 2025",
        "dir": -1
      }
    ],
    "table": {
      "header": [
        "Mar'26",
        "Mar'25",
        "Change(%)"
      ],
      "body": [
        {
          "field": "Net Sales",
          "val1": "524.18",
          "val2": "584.79",
          "chgp": "-10.36%",
          "chgp_class": "negative"
        },
        {
          "field": "Operating Profit (PBDIT) excl Other Income",
          "val1": "60.26",
          "val2": "92.12",
          "chgp": "-34.59%",
          "chgp_class": "negative"
        },
        {
          "field": "Interest",
          "val1": "5.07",
          "val2": "4.19",
          "chgp": "21.00%",
          "chgp_class": "negative"
        },
        {
          "field": "Exceptional Items",
          "val1": "0.00",
          "val2": "26.52",
          "chgp": "-100.00%",
          "chgp_class": "negative"
        },
        {
          "field": "Consolidate Net Profit",
          "val1": "36.91",
          "val2": "84.33",
          "chgp": "-56.23%",
          "chgp_class": "negative"
        },
        {
          "field": "Operating Profit Margin (Excl OI)",
          "val1": "11.50%",
          "val2": "15.75%",
          "chgp": "-4.25%",
          "chgp_class": "negative"
        }
      ]
    }
  }
]

Quarterly Results Snapshot (Consolidated) - Jun'26 - YoYstock-summary

Jun'26
Jun'25
Change(%)
Net Sales
120.35
107.53
11.92%
Operating Profit (PBDIT) excl Other Income
5.89
13.54
-56.50%
Interest
1.49
1.29
15.50%
Exceptional Items
0.00
0.00
Consolidate Net Profit
-0.27
7.40
-103.65%
Operating Profit Margin (Excl OI)
4.89%
12.59%
-7.70%
Values in Rs Cr.
Direction Arrows
Net Sales

YoY Growth in quarter ended Jun 2026 is 11.92% vs -23.74% in Jun 2025

Direction Arrows
Consolidated Net Profit

YoY Growth in quarter ended Jun 2026 is -103.65% vs -78.94% in Jun 2025

Half Yearly Results Snapshot (Consolidated) - Sep'25stock-summary

Sep'25
Sep'24
Change(%)
Net Sales
282.15
293.24
-3.78%
Operating Profit (PBDIT) excl Other Income
45.33
47.15
-3.86%
Interest
2.62
1.85
41.62%
Exceptional Items
0.00
26.52
-100.00%
Consolidate Net Profit
28.67
52.57
-45.46%
Operating Profit Margin (Excl OI)
16.07%
16.08%
-0.01%
Values in Rs Cr.
Direction Arrows
Net Sales

Growth in half year ended Sep 2025 is -3.78% vs 16.73% in Sep 2024

Direction Arrows
Consolidated Net Profit

Growth in half year ended Sep 2025 is -45.46% vs 98.00% in Sep 2024

Nine Monthly Results Snapshot (Consolidated) - Dec'25stock-summary

Dec'25
Dec'24
Change(%)
Net Sales
407.42
431.29
-5.53%
Operating Profit (PBDIT) excl Other Income
54.64
67.94
-19.58%
Interest
3.98
2.79
42.65%
Exceptional Items
0.00
26.52
-100.00%
Consolidate Net Profit
34.58
66.28
-47.83%
Operating Profit Margin (Excl OI)
13.41%
15.75%
-2.34%
Values in Rs Cr.
Direction Arrows
Net Sales

YoY Growth in nine months ended Dec 2025 is -5.53% vs 14.38% in Dec 2024

Direction Arrows
Consolidated Net Profit

YoY Growth in nine months ended Dec 2025 is -47.83% vs 81.09% in Dec 2024

Annual Results Snapshot (Consolidated) - Mar'26stock-summary

Mar'26
Mar'25
Change(%)
Net Sales
524.18
584.79
-10.36%
Operating Profit (PBDIT) excl Other Income
60.26
92.12
-34.59%
Interest
5.07
4.19
21.00%
Exceptional Items
0.00
26.52
-100.00%
Consolidate Net Profit
36.91
84.33
-56.23%
Operating Profit Margin (Excl OI)
11.50%
15.75%
-4.25%
Values in Rs Cr.
Direction Arrows
Net Sales

YoY Growth in year ended Mar 2026 is -10.36% vs 6.14% in Mar 2025

Direction Arrows
Consolidated Net Profit

YoY Growth in year ended Mar 2026 is -56.23% vs 42.88% in Mar 2025

stock-summaryCompany CV
About Bajaj Steel Industries Ltd stock-summary
stock-summary
Bajaj Steel Industries Ltd
Micro Cap
Industrial Manufacturing
Bajaj Steel Industries Limited was incorporated on February 14, 1961 as a private limited Company. It was promoted by Hargovind Bajaj. They started into industrial activity as steel re-rollers. In 1965, Company developed a double roller cotton gin for separating cotton from seed. On October 4, 1985, Company was converted into a public limited company. Bajaj Steel Industries Limited, a significant part of Bajaj Group of Industries, is an India-based company.
Company Coordinates stock-summary
Company Details
C-108 MIDC Industrial Area, Hingna Nagpur Maharashtra : 440028
stock-summary
Tel: 91-712-2720071-80
stock-summary
cs@bajajngp.com
Registrar Details
Adroit Corporate Services Pvt Ltd, 17-20 Jaferbhoy Industrial Estate , 1st Floor, Makwana Road, Marol Naka, Mumbai