
Compare Bajel Projects with Similar Stocks
Dashboard
Healthy long term growth as Net Sales has grown by an annual rate of 54.52% and Operating profit at 312.28%
With a growth in Net Profit of 642.93%, the company declared Very Positive results in Mar 26
With ROCE of 8.3, it has a Fair valuation with a 2.7 Enterprise value to Capital Employed
Increasing Participation by Institutional Investors
Stock DNA
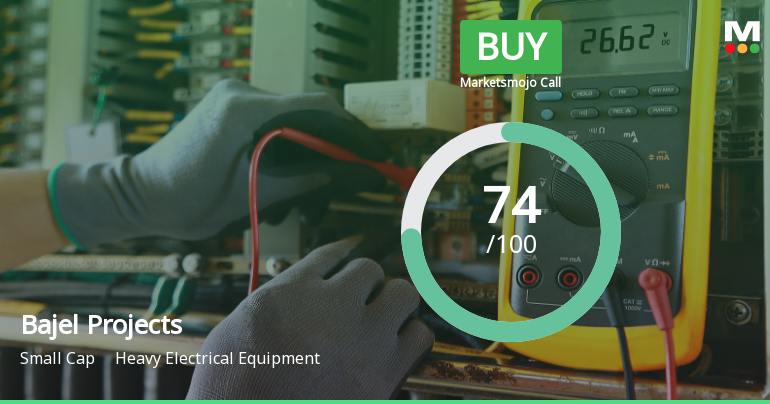
Heavy Electrical Equipment
INR 2,346 Cr (Small Cap)
82.00
NA
0.00%
0.25
3.75%
3.08
Total Returns (Price + Dividend) 
Bajel Projects for the last several years.
Risk Adjusted Returns v/s
Returns Beta

News
Bajel Projects Ltd Upgraded to Buy on Strong Financial and Technical Signals
Bajel Projects Ltd, a small-cap player in the Heavy Electrical Equipment sector, has been upgraded from a Hold to a Buy rating by MarketsMOJO as of 12 June 2026. This upgrade reflects significant improvements across technical indicators, financial trends, valuation metrics, and overall quality assessments, signalling renewed investor confidence in the company’s prospects.
Read full news article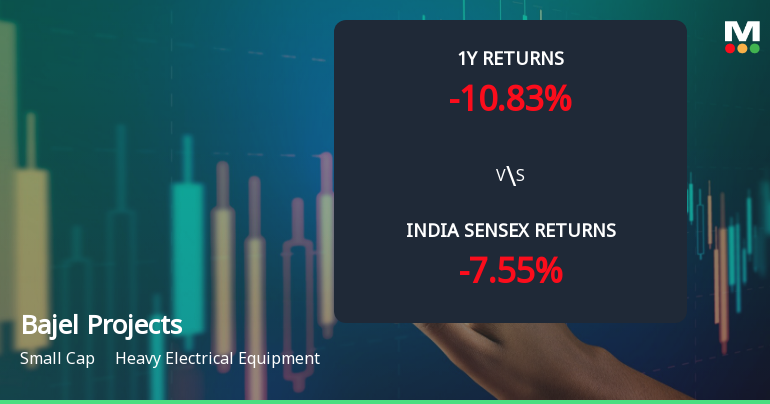
Bajel Projects Ltd Technical Momentum Shifts to Bullish Amid Strong Monthly Gains
Bajel Projects Ltd, a small-cap player in the Heavy Electrical Equipment sector, has witnessed a significant shift in its technical momentum, moving from a sideways trend to a bullish trajectory. This change is underscored by a series of positive signals across key technical indicators, including MACD, moving averages, and Bollinger Bands, suggesting renewed investor interest and potential upside in the near term.
Read full news article
Bajel Projects Ltd is Rated Buy
Bajel Projects Ltd is rated 'Buy' by MarketsMOJO, with this rating last updated on 12 June 2026. However, the analysis and financial metrics presented here reflect the stock's current position as of 14 June 2026, providing investors with the most up-to-date view of the company’s fundamentals, returns, and market standing.
Read full news article Announcements
Announcement under Regulation 30 (LODR)-Award_of_Order_Receipt_of_Order
03-Jun-2026 | Source : BSEAnnouncement under Regulation 30 (LODR) - Bagging of order of EHV Substation
Announcement under Regulation 30 (LODR)-Earnings Call Transcript
03-Jun-2026 | Source : BSEAnnouncement under Regulation 30 (LODR) - Earnings Call Transcripts
Announcement under Regulation 30 (LODR)-Analyst / Investor Meet - Outcome
29-May-2026 | Source : BSEAnnouncement under Regulation 30 (LODR) - Analyst/Investor meet outcome
Corporate Actions

No Upcoming Board Meetings

Bajel Projects Ltd has declared 30% dividend, ex-date: 31 Jul 26

No Splits history available

No Bonus history available

No Rights history available
Quality key factors
Valuation key factors
Technicals key factors
 Technical Indicator Scale: Bearish, Mildly Bearish, Sideways, Mildly Bullish, Bullish Turned
 Shareholding Snapshot : Mar 2026
Shareholding Compare (%holding)
Promoters
2.5484
Held by 3 Schemes (9.52%)
Held by 14 FIIs (0.51%)
Jamnalal Sons Private Limited (19.49%)
Nippon Life India Trustee Ltd-a/c Nippon India Small Cap Fund (9.01%)
20.06%
Quarterly Results Snapshot (Consolidated) - Mar'26 - QoQ

QoQ Growth in quarter ended Mar 2026 is 79.21% vs -8.39% in Dec 2025
QoQ Growth in quarter ended Mar 2026 is 3,466.67% vs -111.67% in Dec 2025
Half Yearly Results Snapshot (Standalone) - Sep'25

Growth in half year ended Sep 2025 is 4.36% vs 195.57% in Sep 2024
Growth in half year ended Sep 2025 is 0.87% vs 249.27% in Sep 2024
Nine Monthly Results Snapshot (Standalone) - Dec'25
YoY Growth in nine months ended Dec 2025 is -0.54% vs 167.81% in Dec 2024
YoY Growth in nine months ended Dec 2025 is 5.64% vs 481.36% in Dec 2024
Annual Results Snapshot (Consolidated) - Mar'26
YoY Growth in year ended Mar 2026 is 7.44% vs 122.22% in Mar 2025
YoY Growth in year ended Mar 2026 is 31.18% vs 260.37% in Mar 2025
About Bajel Projects Ltd

Company Coordinates


