
Compare Balmer Law. Inv. with Similar Stocks
Dashboard
Weak Long Term Fundamental Strength with an average Return on Equity (ROE) of 11.31%
With ROE of 12.4, it has a Expensive valuation with a 1.1 Price to Book Value
Despite the size of the company, domestic mutual funds hold only 0.01% of the company
Underperformed the market in the last 1 year
Stock DNA
Non Banking Financial Company (NBFC)
INR 1,561 Cr (Small Cap)
9.00
22
9.00%
0.15
12.39%
1.08
Total Returns (Price + Dividend) 
Latest dividend: 2.03 per share ex-dividend date: Mar-20-2026
Risk Adjusted Returns v/s
Returns Beta

News

Balmer Lawrie Investment Ltd is Rated Strong Sell
Balmer Lawrie Investment Ltd is rated Strong Sell by MarketsMOJO. This rating was last updated on 01 June 2026, reflecting a shift from the previous 'Sell' grade. However, the analysis and financial metrics presented here are based on the stock's current position as of 05 July 2026, providing investors with the most recent and relevant data to assess the company’s outlook.
Read full news article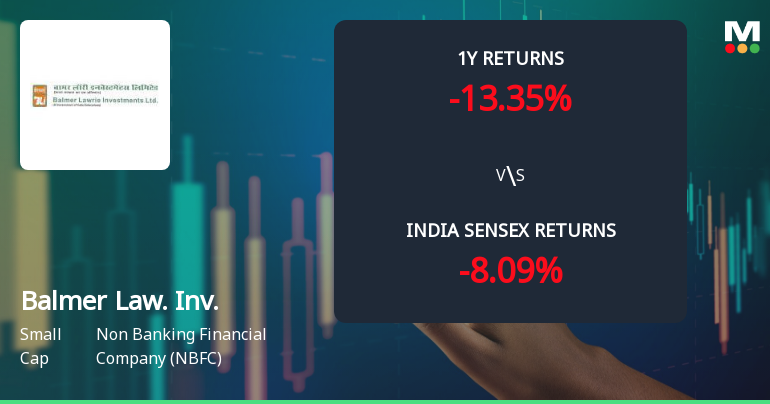
Balmer Lawrie Investment Ltd Faces Bearish Momentum Amid Technical Downturn
Balmer Lawrie Investment Ltd, a small-cap player in the Non Banking Financial Company (NBFC) sector, has experienced a notable shift in its technical momentum, moving from a mildly bearish stance to a more pronounced bearish trend. Recent technical indicators including MACD, RSI, Bollinger Bands, and moving averages signal increasing downside pressure, reflecting investor caution amid subdued price action and underperformance relative to benchmarks.
Read full news article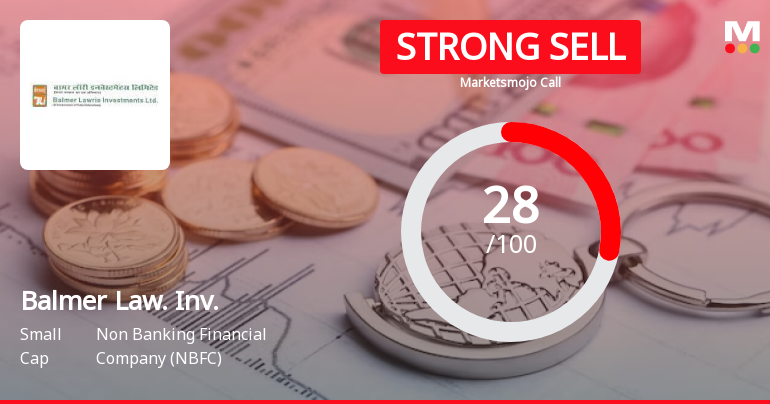
Balmer Lawrie Investment Ltd is Rated Strong Sell
Balmer Lawrie Investment Ltd is rated Strong Sell by MarketsMOJO. This rating was last updated on 01 June 2026. However, the analysis and financial metrics presented here reflect the stock’s current position as of 24 June 2026, providing investors with the latest insights into the company’s performance and outlook.
Read full news article Announcements
Closure of Trading Window
24-Jun-2026 | Source : BSEIntimation for Closure of Trading Window with effect from 1st July 2026
Announcement under Regulation 30 (LODR)-Newspaper Publication
22-Jun-2026 | Source : BSENewspaper Publication in Bangla for Special Window and Second 100 days campaign Saksham Niveshak
Announcement under Regulation 30 (LODR)-Newspaper Publication
20-Jun-2026 | Source : BSENewspaper Publications in English and Hindi Language for Special Window and Second 100 Days Campaign
Corporate Actions

No Upcoming Board Meetings

Balmer Lawrie Investment Ltd has declared 203% dividend, ex-date: 20 Mar 26

Balmer Lawrie Investment Ltd has announced 1:10 stock split, ex-date: 09 Aug 24

No Bonus history available

No Rights history available
Quality key factors
Valuation key factors
Technicals key factors
 Technical Indicator Scale: Bearish, Mildly Bearish, Sideways, Mildly Bullish, Bullish Turned
 Shareholding Snapshot : Mar 2026
Shareholding Compare (%holding)
Promoters
None
Held by 1 Schemes (0.0%)
Held by 37 FIIs (1.06%)
President Of India (59.67%)
Cd Equifinance Private Limited (7.24%)
24.62%
Quarterly Results Snapshot (Consolidated) - Mar'26 - QoQ

QoQ Growth in quarter ended Mar 2026 is 13.19% vs 3.28% in Dec 2025
QoQ Growth in quarter ended Mar 2026 is 26.63% vs 15.86% in Dec 2025
Half Yearly Results Snapshot (Consolidated) - Sep'25

Growth in half year ended Sep 2025 is 3.09% vs 8.49% in Sep 2024
Growth in half year ended Sep 2025 is -0.16% vs 5.26% in Sep 2024
Nine Monthly Results Snapshot (Consolidated) - Dec'25
YoY Growth in nine months ended Dec 2025 is 3.44% vs 8.28% in Dec 2024
YoY Growth in nine months ended Dec 2025 is 0.72% vs 2.31% in Dec 2024
Annual Results Snapshot (Consolidated) - Mar'26
YoY Growth in year ended Mar 2026 is 7.96% vs 7.59% in Mar 2025
YoY Growth in year ended Mar 2026 is 3.94% vs 11.07% in Mar 2025
About Balmer Lawrie Investment Ltd

Company Coordinates


