
Compare Balmer Law. Inv. with Similar Stocks
Dashboard
Weak Long Term Fundamental Strength with an average Return on Equity (ROE) of 11.31%
With ROE of 12.4, it has a Expensive valuation with a 1.1 Price to Book Value
Despite the size of the company, domestic mutual funds hold only 0.01% of the company
Underperformed the market in the last 1 year
Stock DNA
Non Banking Financial Company (NBFC)
INR 1,574 Cr (Small Cap)
9.00
20
9.03%
0.15
12.39%
1.08
Total Returns (Price + Dividend) 
Latest dividend: 2.03 per share ex-dividend date: Mar-20-2026
Risk Adjusted Returns v/s
Returns Beta

News
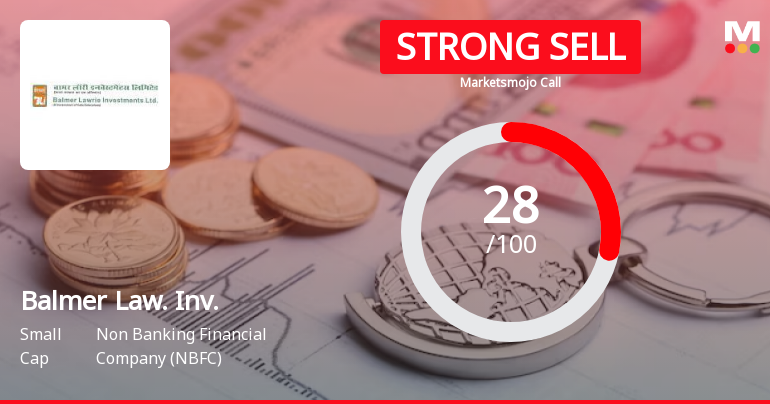
Balmer Lawrie Investment Ltd is Rated Strong Sell
Balmer Lawrie Investment Ltd is rated Strong Sell by MarketsMOJO. This rating was last updated on 01 June 2026, reflecting a reassessment of the stock’s outlook. However, all fundamentals, returns, and financial metrics discussed here are current as of 13 June 2026, providing investors with the latest perspective on the company’s position.
Read full news article
Balmer Lawrie Investment Ltd Downgraded to Strong Sell Amid Mixed Financials and Bearish Technicals
Balmer Lawrie Investment Ltd, a small-cap player in the Non Banking Financial Company (NBFC) sector, has seen its investment rating downgraded from Sell to Strong Sell as of 1 June 2026. This shift reflects a complex interplay of deteriorating technical indicators, valuation pressures, and mixed financial trends, despite some positive quarterly results. The company’s current Mojo Score stands at 28.0, reinforcing the cautious stance among market analysts.
Read full news article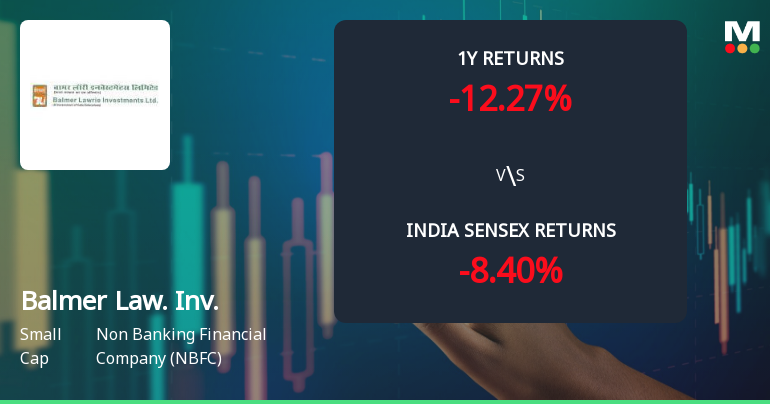
Balmer Lawrie Investment Ltd Technical Momentum Shifts Amid Mixed Market Signals
Balmer Lawrie Investment Ltd, a small-cap player in the Non Banking Financial Company (NBFC) sector, has experienced a subtle shift in its technical momentum, moving from a sideways trend to a mildly bearish stance. Despite a recent downgrade in its Mojo Grade from Strong Sell to Sell, the stock exhibits a complex interplay of technical indicators that suggest cautious investor sentiment amid mixed signals.
Read full news article Announcements
Compliances-Reg.24(A)-Annual Secretarial Compliance
29-May-2026 | Source : BSESecretarial Compliance Report for the Financial Year ended on 31st March 2026
Announcement under Regulation 30 (LODR)-Meeting Updates
21-May-2026 | Source : BSEDecision of the Board of Directors not to Buy Back the shares of the Company as the thresholds were not triggered as per the DIPAM Guidelines
Announcement under Regulation 30 (LODR)-Meeting Updates
21-May-2026 | Source : BSEDecision of the Board of Directors not to recommend Splitting of Shares of the Company as the thresholds stated in the DIPAM Guidelines were not triggered
Corporate Actions

No Upcoming Board Meetings

Balmer Lawrie Investment Ltd has declared 203% dividend, ex-date: 20 Mar 26

Balmer Lawrie Investment Ltd has announced 1:10 stock split, ex-date: 09 Aug 24

No Bonus history available

No Rights history available
Quality key factors
Valuation key factors
Technicals key factors
 Technical Indicator Scale: Bearish, Mildly Bearish, Sideways, Mildly Bullish, Bullish Turned
 Shareholding Snapshot : Mar 2026
Shareholding Compare (%holding)
Promoters
None
Held by 1 Schemes (0.0%)
Held by 37 FIIs (1.06%)
President Of India (59.67%)
Cd Equifinance Private Limited (7.24%)
24.62%
Quarterly Results Snapshot (Consolidated) - Mar'26 - QoQ

QoQ Growth in quarter ended Mar 2026 is 13.19% vs 3.28% in Dec 2025
QoQ Growth in quarter ended Mar 2026 is 26.63% vs 15.86% in Dec 2025
Half Yearly Results Snapshot (Consolidated) - Sep'25

Growth in half year ended Sep 2025 is 3.09% vs 8.49% in Sep 2024
Growth in half year ended Sep 2025 is -0.16% vs 5.26% in Sep 2024
Nine Monthly Results Snapshot (Consolidated) - Dec'25
YoY Growth in nine months ended Dec 2025 is 3.44% vs 8.28% in Dec 2024
YoY Growth in nine months ended Dec 2025 is 0.72% vs 2.31% in Dec 2024
Annual Results Snapshot (Consolidated) - Mar'26
YoY Growth in year ended Mar 2026 is 7.96% vs 7.59% in Mar 2025
YoY Growth in year ended Mar 2026 is 3.94% vs 11.07% in Mar 2025
About Balmer Lawrie Investment Ltd

Company Coordinates


