
Compare Balrampur Chini with Similar Stocks
Dashboard
Low ability to service debt as the company has a high Debt to EBITDA ratio of 4.28 times
- Low ability to service debt as the company has a high Debt to EBITDA ratio of 4.28 times
Poor long term growth as Operating profit has grown by an annual rate -1.29% of over the last 5 years
With ROCE of 7.7, it has a Expensive valuation with a 2 Enterprise value to Capital Employed
Total Returns (Price + Dividend) 
Latest dividend: 3.498516792033054 per share ex-dividend date: Nov-17-2025
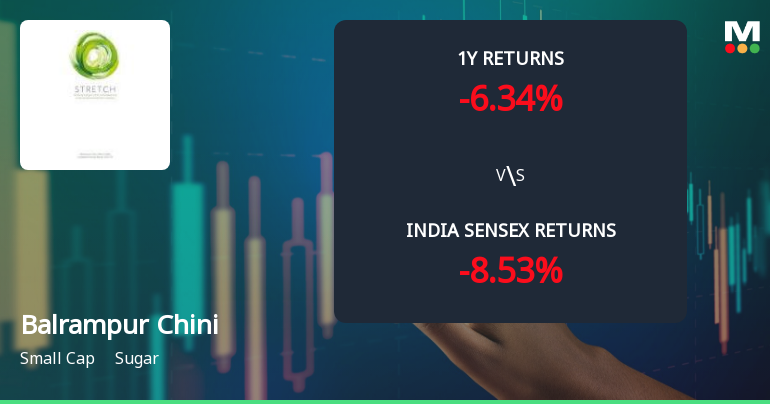
Risk Adjusted Returns v/s
Returns Beta

News
Balrampur Chini Mills Ltd Sees Bullish Momentum Amid Technical Upgrades
Balrampur Chini Mills Ltd has exhibited a notable shift in price momentum, transitioning from a mildly bullish to a bullish technical trend. This change is underpinned by a series of positive signals across key technical indicators including MACD, Bollinger Bands, and moving averages, suggesting renewed investor interest despite a recent downgrade in its Mojo Grade to Sell.
Read full news article
Balrampur Chini Mills Downgraded to Sell Amid Valuation and Financial Concerns
Balrampur Chini Mills Ltd, a prominent player in the sugar sector, has seen its investment rating downgraded from Hold to Sell as of 29 June 2026. This shift reflects a combination of deteriorating financial trends, expensive valuation metrics, and a weakening technical outlook, despite the company’s strong market position and long-term returns outperforming the Sensex.
Read full news article
Balrampur Chini Mills Ltd Technical Momentum Shifts Amid Mixed Market Signals
Balrampur Chini Mills Ltd, a small-cap player in the sugar sector, has experienced a nuanced shift in its technical momentum, reflecting a complex interplay of bullish and bearish signals across multiple timeframes. Despite a recent downgrade from Hold to Sell by MarketsMOJO, the stock’s price action and technical indicators reveal a cautiously optimistic outlook tempered by underlying weaknesses.
Read full news article Announcements
Closure of Trading Window
25-Jun-2026 | Source : BSEClosure of Trading Window on and from 1st July 2026 till the expiry of 48 hours after the declaration of Unaudited Financial Results of the Company for the Quarter ended 30th June 2026
Announcement under Regulation 30 (LODR)-Analyst / Investor Meet - Intimation
20-Jun-2026 | Source : BSECompanys Management will be interacting with the Analyst(s)/Investor(s) in the Analyst meet organized by 360 One Capital Market Private Limited
Announcement under Regulation 30 (LODR)-Investor Presentation
20-Jun-2026 | Source : BSEThe Company has submitted the Updated Corporate Presentation.
Corporate Actions

No Upcoming Board Meetings

Balrampur Chini Mills Ltd has declared 350% dividend, ex-date: 17 Nov 25

No Splits history available

No Bonus history available

No Rights history available
Quality key factors
Valuation key factors
Technicals key factors
 Technical Indicator Scale: Bearish, Mildly Bearish, Sideways, Mildly Bullish, Bullish Turned
 Shareholding Snapshot : Jun 2026
Shareholding Compare (%holding)
Promoters
None
Held by 28 Schemes (25.54%)
Held by 129 FIIs (9.44%)
Saraogi Family Trust (vivek Saraogi-trustee) (24.83%)
Sbi Retirement Benefit Fund - Conservative Hybrid (6.28%)
14.81%
Quarterly Results Snapshot (Consolidated) - Mar'26 - YoY

YoY Growth in quarter ended Mar 2026 is 6.67% vs 4.84% in Mar 2025

YoY Growth in quarter ended Mar 2026 is -30.36% vs 12.65% in Mar 2025
Half Yearly Results Snapshot (Consolidated) - Sep'25
Growth in half year ended Sep 2025 is 18.15% vs -7.15% in Sep 2024
Growth in half year ended Sep 2025 is -23.21% vs -42.72% in Sep 2024
Nine Monthly Results Snapshot (Consolidated) - Dec'25
YoY Growth in nine months ended Dec 2025 is 19.31% vs -5.96% in Dec 2024
YoY Growth in nine months ended Dec 2025 is 5.34% vs -37.24% in Dec 2024
Annual Results Snapshot (Consolidated) - Mar'26
YoY Growth in year ended Mar 2026 is 15.80% vs -3.19% in Mar 2025
YoY Growth in year ended Mar 2026 is -13.38% vs -18.25% in Mar 2025
About Balrampur Chini Mills Ltd

Company Coordinates


