
 Price Point
Compare Balrampur Chini with Similar Stocks
ScoreDashboard
Low ability to service debt as the company has a high Debt to EBITDA ratio of 4.28 times
- Low ability to service debt as the company has a high Debt to EBITDA ratio of 4.28 times
Poor long term growth as Net Sales has grown by an annual rate of 7.08% and Operating profit at 0.99% over the last 5 years
The company has declared negative results for the last 2 consecutive quarters
With ROCE of 7.7, it has a Expensive valuation with a 2.4 Enterprise value to Capital Employed


 Total Returns
Total Returns (Price + Dividend) 
Latest dividend: 3.5 per share ex-dividend date: Nov-17-2025
Risk Adjusted Returns v/s
Returns Beta
 News & Corporate Actions
News
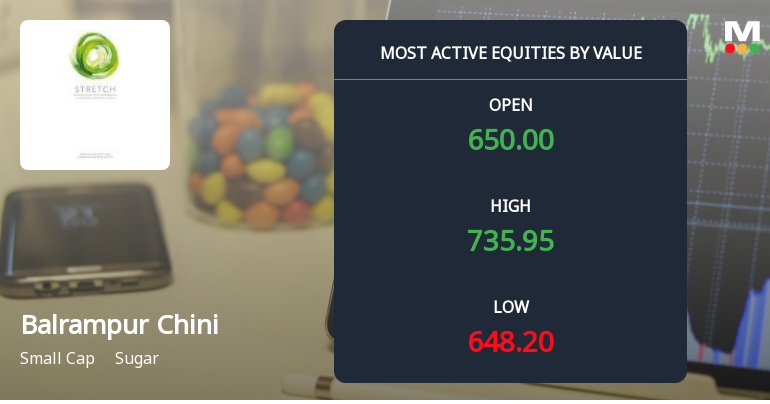
Balrampur Chini Mills Ltd Sees Surge in Value Trading Amid Sector Outperformance
Balrampur Chini Mills Ltd (BALRAMCHIN), a prominent player in the sugar sector, witnessed significant trading activity on 31 Aug 2026, emerging as one of the highest value turnover stocks on the day. The small-cap company outperformed its sector peers with a strong price rally, driven by robust volume and institutional interest, despite a recent downgrade in its mojo grade.
Read full news article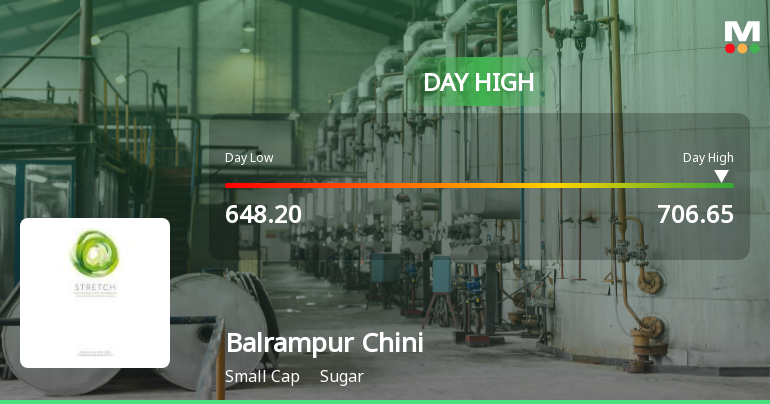
Balrampur Chini Mills Ltd Surges 7.03% to Day's High of Rs 697.65 — Outperforms Sugar Sector by 3.49 Percentage Points
While the Sensex declined by 0.61% on 31 Aug 2026, Balrampur Chini Mills Ltd surged 7.03%, marking a notable outperformance of 3.49 percentage points over its sector. This sharp intraday gain rewrites the short-term narrative for the sugar small-cap, raising the question of whether this is a breakout or a continuation of existing momentum.
Read full news article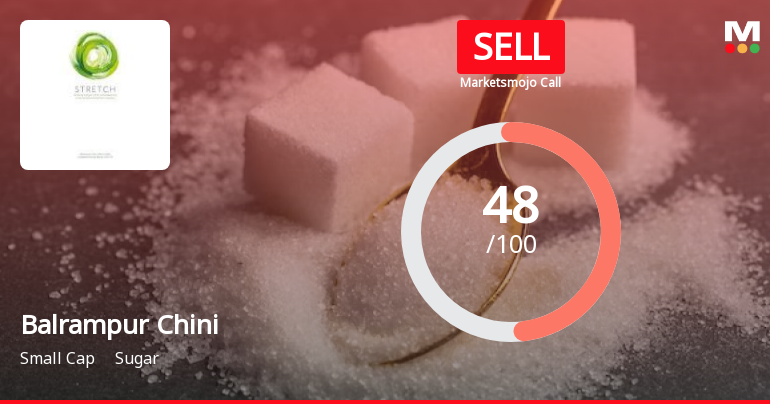
Balrampur Chini Mills Ltd is Rated Sell
Balrampur Chini Mills Ltd is rated Sell by MarketsMOJO, with this rating last updated on 11 August 2026. However, the analysis and financial metrics discussed here reflect the company’s current position as of 31 August 2026, providing investors with the latest insights into its performance and outlook.
Read full news article Announcements
Balrampur Chini Mills Limited - Other General Purpose
09-Dec-2019 | Source : NSEBalrampur Chini Mills Limited has informed the Exchange regarding Compliance under Regulation 23(9) of SEBI (Listing Obligations and Disclosure Requirements) Regulations, 2015.
Balrampur Chini Mills Limited - Analysts/Institutional Investor Meet/Con. Call Updates
03-Dec-2019 | Source : NSEBalrampur Chini Mills Limited has informed the Exchange regarding Analysts/Institutional Investor Meet/Con. Call Updates
Balrampur Chini Mills Limited - Analysts/Institutional Investor Meet/Con. Call Updates
26-Nov-2019 | Source : NSEBalrampur Chini Mills Limited has informed the Exchange regarding Analysts/Institutional Investor Meet/Con. Call Updates
Corporate Actions

No Upcoming Board Meetings

Balrampur Chini Mills Ltd has declared 350% dividend, ex-date: 17 Nov 25

No Splits history available

No Bonus history available

No Rights history available
Key FactorsQuality key factors
Valuation key factors
Technicals key factors
 Technical Indicator Scale: Bearish, Mildly Bearish, Sideways, Mildly Bullish, Bullish Turned Shareholding
Shareholding Snapshot : Jun 2026
Shareholding Compare (%holding)
Promoters
None
Held by 27 Schemes (25.83%)
Held by 128 FIIs (9.33%)
Saraogi Family Trust (vivek Saraogi-trustee) (24.83%)
Sbi Mutual Fund (6.96%)
14.76%
FinancialQuarterly Results Snapshot (Consolidated) - Jun'26 - YoY
 Compare with Peers
YoY Growth in quarter ended Jun 2026 is 6.13% vs 8.49% in Jun 2025

YoY Growth in quarter ended Jun 2026 is -14.39% vs -26.49% in Jun 2025

Half Yearly Results Snapshot (Consolidated) - Sep'25
Growth in half year ended Sep 2025 is 18.15% vs -7.15% in Sep 2024
Growth in half year ended Sep 2025 is -23.21% vs -42.72% in Sep 2024
Nine Monthly Results Snapshot (Consolidated) - Dec'25
YoY Growth in nine months ended Dec 2025 is 19.31% vs -5.96% in Dec 2024
YoY Growth in nine months ended Dec 2025 is 5.34% vs -37.24% in Dec 2024
Annual Results Snapshot (Consolidated) - Mar'26
YoY Growth in year ended Mar 2026 is 15.80% vs -3.19% in Mar 2025
YoY Growth in year ended Mar 2026 is -13.38% vs -18.25% in Mar 2025
 Company CV
About Balrampur Chini Mills Ltd

Company Coordinates










