
Compare Asgard Alcobev with Similar Stocks
Dashboard
Weak Long Term Fundamental Strength with an average Return on Capital Employed (ROCE) of 0%
- Poor long term growth as Net Sales has grown by an annual rate of -7.70% and Operating profit at -17.59% over the last 5 years
With ROCE of 4.5, it has a Very Expensive valuation with a 9.6 Enterprise value to Capital Employed
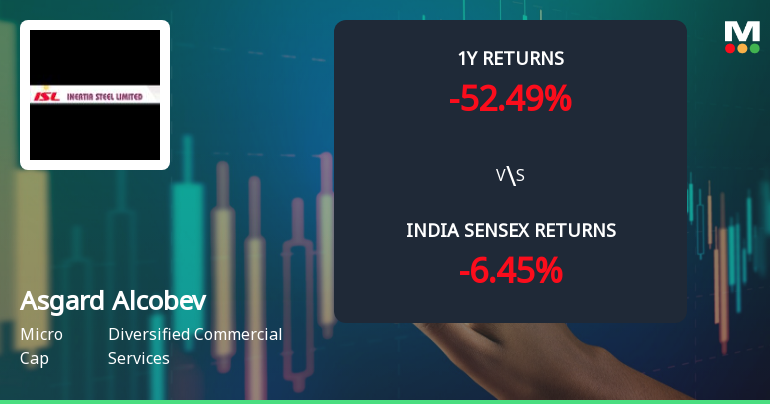
Underperformed the market in the last 1 year
Stock DNA
Diversified Commercial Services
INR 1,057 Cr (Micro Cap)
415.00
23
0.00%
1.58
5.61%
23.55
Total Returns (Price + Dividend) 
Asgard Alcobev for the last several years.
Risk Adjusted Returns v/s
Returns Beta

News
Asgard Alcobev Ltd Technical Momentum Shifts Amid Bearish Sentiment
Asgard Alcobev Ltd, a micro-cap player in the Diversified Commercial Services sector, has experienced a subtle shift in its technical momentum, moving from a bearish to a mildly bearish trend. Despite a modest day gain of 1.20%, the stock’s broader technical indicators reveal a complex picture, with mixed signals from MACD, RSI, and moving averages, underscoring the challenges facing investors amid a prolonged downtrend.
Read full news article
Asgard Alcobev Ltd is Rated Strong Sell
Asgard Alcobev Ltd is rated Strong Sell by MarketsMOJO, with this rating last updated on 15 February 2026. However, the analysis and financial metrics discussed here reflect the stock's current position as of 20 June 2026, providing investors with an up-to-date view of its performance and outlook.
Read full news article
Asgard Alcobev Ltd Faces Bearish Momentum Amid Technical Downturn
Asgard Alcobev Ltd, a micro-cap player in the Diversified Commercial Services sector, has experienced a notable shift in its technical momentum, moving from a mildly bearish stance to a more pronounced bearish trend. Recent technical indicators, including MACD, RSI, and moving averages, signal increasing downside pressure, reflecting challenges for investors amid a broader market context.
Read full news article Announcements
Announcement under Regulation 30 (LODR)-Change in Registered Office Address
27-Jun-2026 | Source : BSEApproval for Shifting of Registered officer from the State of Maharashtra to the State of Meghalaya
Appointment of Company Secretary and Compliance Officer
27-Jun-2026 | Source : BSEAppointment of Mr. Sarimul Haque Talukdar as Company Secretary and Compliance officer of the Company
Closure of Trading Window
26-Jun-2026 | Source : BSEIntimation about closure of Trading Window for all Designated and Connected Persons upto 48 hours of declaration of unaudited financial results for Quarter ended on 30th June 2026.
Corporate Actions

No Upcoming Board Meetings

No Dividend history available

Asgard Alcobev Ltd has announced 1:10 stock split, ex-date: 03 Jan 25

No Bonus history available

No Rights history available
Quality key factors
Valuation key factors
Technicals key factors
 Technical Indicator Scale: Bearish, Mildly Bearish, Sideways, Mildly Bullish, Bullish Turned
 Shareholding Snapshot : Mar 2026
Shareholding Compare (%holding)
Promoters
None
Held by 0 Schemes
Held by 0 FIIs
Ronak Jain (38.19%)
Jasmine Bonny Agitok Sangma (9.55%)
33.47%
Quarterly Results Snapshot (Consolidated) - Mar'26 - YoY

YoY Growth in quarter ended Mar 2026 is 78.28% vs 18,527.27% in Mar 2025
YoY Growth in quarter ended Mar 2026 is -49.00% vs 10,100.00% in Mar 2025
Half Yearly Results Snapshot (Consolidated) - Sep'25
Growth in half year ended Sep 2025 is 168.25% vs 8,784.21% in Sep 2024
Growth in half year ended Sep 2025 is 583.33% vs 1,100.00% in Sep 2024
Nine Monthly Results Snapshot (Consolidated) - Dec'25
YoY Growth in nine months ended Dec 2025 is 72.79% vs 12,865.52% in Dec 2024
YoY Growth in nine months ended Dec 2025 is 1.14% vs 8,900.00% in Dec 2024
Annual Results Snapshot (Consolidated) - Mar'26
YoY Growth in year ended Mar 2026 is 74.72% vs 14,797.44% in Mar 2025
YoY Growth in year ended Mar 2026 is -48.40% vs 9,500.00% in Mar 2025
About Asgard Alcobev Ltd

Company Coordinates


