
Compare Bank Of Baroda with Similar Stocks
Dashboard
Strong lending practices with low Gross NPA ratio of 1.89%
Strong Long Term Fundamental Strength with a 89.06% CAGR growth in Net Profits
Healthy long term growth as Net profit has grown by an annual rate of 89.06%
Flat results in Mar 26
With ROA of 1, it has a Very Attractive valuation with a 0.9 Price to Book Value
High Institutional Holdings at 28.69%
Market Beating Performance
Total Returns (Price + Dividend) 
Latest dividend: 8.5 per share ex-dividend date: Jun-05-2026
Risk Adjusted Returns v/s
Returns Beta

News

Bank Of Baroda Technical Momentum Shifts Signal Mildly Bullish Outlook
Bank Of Baroda (NSE: 824055) has exhibited a notable shift in its technical momentum, moving from a sideways trend to a mildly bullish stance. This change is underscored by a mixed but generally positive set of technical indicators, including MACD, Bollinger Bands, and KST, which suggest cautious optimism for investors amid a large-cap banking sector backdrop.
Read full news article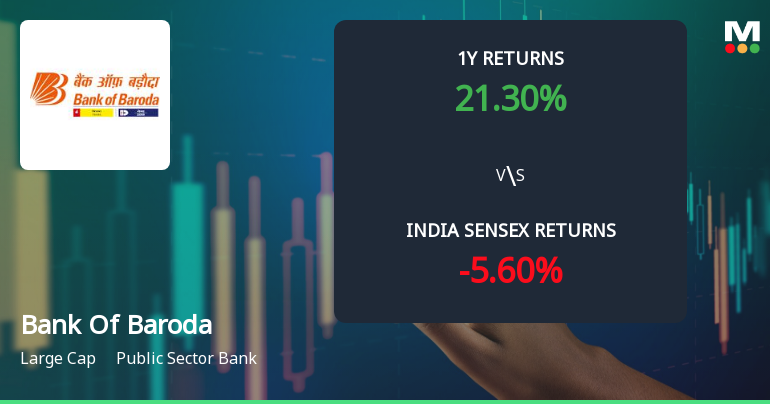
Bank Of Baroda Technical Momentum Shifts to Sideways Amid Mixed Indicator Signals
Bank Of Baroda (NSE: 824055) has recently exhibited a notable shift in its technical momentum, moving from a mildly bearish stance to a sideways trend. This transition is underscored by a complex interplay of technical indicators, including MACD, RSI, Bollinger Bands, and moving averages, which collectively paint a nuanced picture of the stock’s near-term prospects amid a challenging banking sector environment.
Read full news article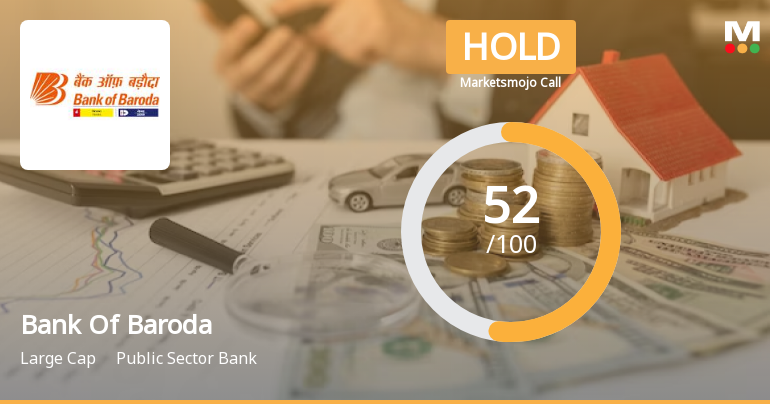
Bank Of Baroda is Rated Hold by MarketsMOJO
Bank Of Baroda is rated 'Hold' by MarketsMOJO, with this rating last updated on 25 May 2026. However, the analysis and financial metrics discussed here reflect the stock's current position as of 19 June 2026, providing investors with an up-to-date perspective on the company’s fundamentals, valuation, financial trends, and technical outlook.
Read full news article Announcements
Proceedings And Voting Results Of 30Th AGM Held On 23.06.2026
23-Jun-2026 | Source : BSEProceedings and Voting Results of 30th AGM held on 23.06.2026
Investor Engagement Meeting
22-Jun-2026 | Source : BSEInvestor Engagement Meeting held on 22.06.2026
Credit Rating
22-Jun-2026 | Source : BSECredit Rating
Corporate Actions

No Upcoming Board Meetings

Bank Of Baroda has declared 425% dividend, ex-date: 05 Jun 26

Bank Of Baroda has announced 2:10 stock split, ex-date: 22 Jan 15

No Bonus history available

No Rights history available
Quality key factors
Valuation key factors
Technicals key factors
 Technical Indicator Scale: Bearish, Mildly Bearish, Sideways, Mildly Bullish, Bullish Turned
 Shareholding Snapshot : Mar 2026
Shareholding Compare (%holding)
Promoters
None
Held by 46 Schemes (10.46%)
Held by 763 FIIs (9.69%)
President Of India (63.97%)
Lic New Endowment Plus Growth Fund (5.84%)
6.0%
Quarterly Results Snapshot (Standalone) - Mar'26 - QoQ

QoQ Growth in quarter ended Mar 2026 is 2.81% vs 0.76% in Dec 2025
QoQ Growth in quarter ended Mar 2026 is 11.10% vs 5.10% in Dec 2025
Half Yearly Results Snapshot (Standalone) - Sep'25

Growth in half year ended Sep 2025 is 4.5% vs 10.09% in Sep 2024
Growth in half year ended Sep 2025 is -3.56% vs 16.50% in Sep 2024
Nine Monthly Results Snapshot (Standalone) - Dec'25
YoY Growth in nine months ended Dec 2025 is 3.89% vs 9.39% in Dec 2024
YoY Growth in nine months ended Dec 2025 is -0.88% vs 12.64% in Dec 2024
Annual Results Snapshot (Standalone) - Mar'26
YoY Growth in year ended Mar 2026 is 3.84% vs 8.61% in Mar 2025
YoY Growth in year ended Mar 2026 is 2.25% vs 10.08% in Mar 2025
About Bank Of Baroda

Company Coordinates


