
Compare Bannari Amm.Sug. with Similar Stocks
Dashboard
Weak Long Term Fundamental Strength with a -1.16% CAGR growth in Operating Profits over the last 5 years
- The company has been able to generate a Return on Equity (avg) of 7.50% signifying low profitability per unit of shareholders funds
Flat results in Mar 26
With ROE of 7.7, it has a Expensive valuation with a 2.4 Price to Book Value
Despite the size of the company, domestic mutual funds hold only 0% of the company
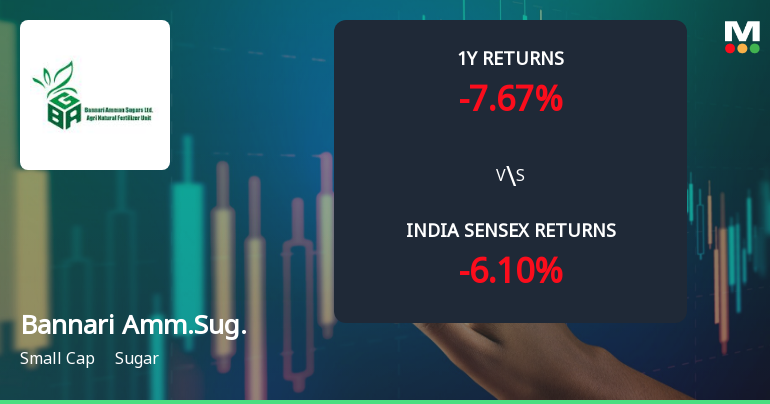
Below par performance in long term as well as near term
Total Returns (Price + Dividend) 
Latest dividend: 12.5 per share ex-dividend date: Aug-22-2025
Risk Adjusted Returns v/s
Returns Beta

News
Bannari Amman Sugars Ltd Faces Mixed Technical Signals Amid Price Momentum Shift
Bannari Amman Sugars Ltd has experienced a subtle shift in its technical momentum, moving from a bullish to a mildly bullish stance as of mid-June 2026. Despite a recent downgrade in its Mojo Grade from Hold to Sell, the stock’s technical indicators present a complex picture, with mixed signals across weekly and monthly timeframes. This analysis delves into the latest price action, momentum oscillators, and moving averages to provide a comprehensive view of the stock’s near-term prospects within the sugar sector.
Read full news article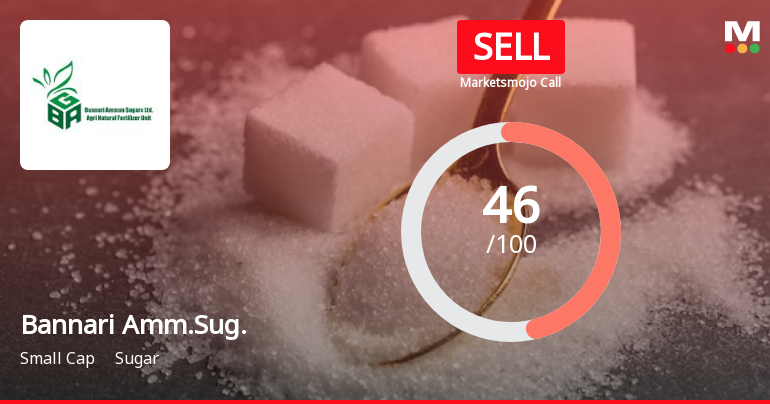
Bannari Amman Sugars Ltd is Rated Sell
Bannari Amman Sugars Ltd is rated 'Sell' by MarketsMOJO, with this rating last updated on 29 May 2026. However, the analysis and financial metrics discussed here reflect the stock's current position as of 15 June 2026, providing investors with an up-to-date perspective on the company’s fundamentals, valuation, financial trends, and technical outlook.
Read full news article
Bannari Amman Sugars Ltd Technical Momentum Shifts Amid Mixed Market Signals
Bannari Amman Sugars Ltd has recently experienced a notable shift in its technical momentum, moving from a mildly bullish stance to a more confident bullish trend on weekly charts. Despite mixed signals across monthly indicators, the stock’s daily moving averages and several weekly technical parameters suggest an improving price momentum, signalling potential opportunities and risks for investors in this small-cap sugar sector player.
Read full news article Announcements
Announcement under Regulation 30 (LODR)-Newspaper Publication
29-May-2026 | Source : BSEAnnual Financial Results - Newspaper publication
Board Meeting Outcome for Intimation Under Regulation 30 Of SEBI LODR About The Outcome Of The Board Meeting Along With Audited Financials And Declaration Of Dividend
27-May-2026 | Source : BSEOutcome of the Board Meeting along with Audited Financials and Declaration of Dividend
AUDITED FINANCIAL RESULTS FOR THE QUARTER AND YEAR ENDED 31.03.2026
27-May-2026 | Source : BSEThe Board of Directors of the Company at its meeting held today the 27th May 2026 inter-alia to consider the Audited Financial Results for the quarter and year ended 31st March 2026
Corporate Actions

No Upcoming Board Meetings

Bannari Amman Sugars Ltd has declared 125% dividend, ex-date: 22 Aug 25

No Splits history available

No Bonus history available

No Rights history available
Quality key factors
Valuation key factors
Technicals key factors
 Technical Indicator Scale: Bearish, Mildly Bearish, Sideways, Mildly Bullish, Bullish Turned
 Shareholding Snapshot : Sep 2025
Shareholding Compare (%holding)
Promoters
None
Held by 1 Schemes (0.0%)
Held by 24 FIIs (0.28%)
Svb Holdings Private Limited (44.0%)
Gagandeep Credit Capital Pvt Ltd (5.53%)
22.05%
Quarterly Results Snapshot (Standalone) - Mar'26 - QoQ

QoQ Growth in quarter ended Mar 2026 is -56.17% vs 12.68% in Dec 2025
QoQ Growth in quarter ended Mar 2026 is -14.07% vs 13.33% in Dec 2025
Half Yearly Results Snapshot (Standalone) - Sep'25

Growth in half year ended Sep 2025 is 12.83% vs -14.87% in Sep 2024
Growth in half year ended Sep 2025 is 42.38% vs -34.78% in Sep 2024
Nine Monthly Results Snapshot (Standalone) - Dec'25
YoY Growth in nine months ended Dec 2025 is 25.81% vs -27.79% in Dec 2024
YoY Growth in nine months ended Dec 2025 is 52.99% vs -46.72% in Dec 2024
Annual Results Snapshot (Standalone) - Mar'26
YoY Growth in year ended Mar 2026 is 6.90% vs -19.25% in Mar 2025
YoY Growth in year ended Mar 2026 is 41.32% vs -31.27% in Mar 2025
About Bannari Amman Sugars Ltd

Company Coordinates


