
Compare Bannari Amm Spg. with Similar Stocks
Dashboard
Weak Long Term Fundamental Strength with a -3.10% CAGR growth in Net Sales over the last 5 years
- Low ability to service debt as the company has a high Debt to EBITDA ratio of 4.62 times
- The company has been able to generate a Return on Equity (avg) of 2.94% signifying low profitability per unit of shareholders funds
Flat results in Mar 26
Consistent Underperformance against the benchmark over the last 3 years
Stock DNA
Garments & Apparels
INR 213 Cr (Micro Cap)
15.00
25
0.00%
0.83
3.09%
0.45
Total Returns (Price + Dividend) 
Latest dividend: 0.5914786967418546 per share ex-dividend date: Sep-16-2022
Risk Adjusted Returns v/s
Returns Beta

News

Bannari Amman Spinning Mills Ltd Upgraded to Hold on Technical Improvements and Valuation Appeal
Bannari Amman Spinning Mills Ltd has seen its investment rating upgraded from Sell to Hold, reflecting a nuanced improvement across technical indicators and valuation metrics despite ongoing challenges in financial trends and long-term fundamentals. The upgrade, effective from 08 Jul 2026, is primarily driven by a bullish shift in technicals and attractive valuation ratios, signalling cautious optimism for investors in this micro-cap garment and apparel stock.
Read full news article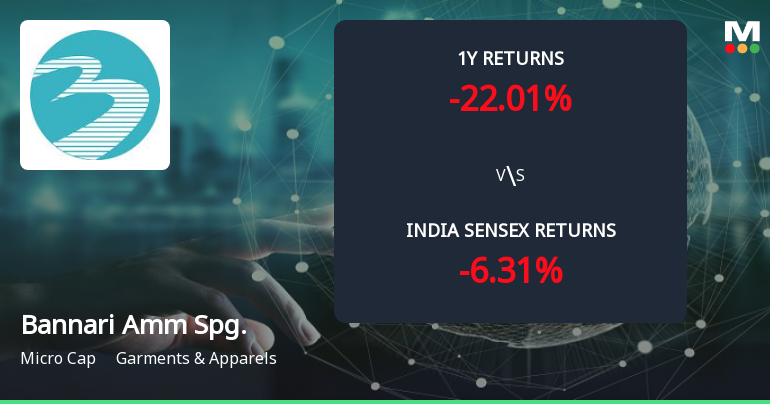
Bannari Amman Spinning Mills Ltd Forms Golden Cross Amid Mixed Technical Signals
The 50-day moving average for Bannari Amman Spinning Mills Ltd has crossed above the 200-day moving average, creating a golden cross on 7 Jul 2026. Yet, the broader technical and fundamental picture presents a nuanced scenario that tempers the enthusiasm such a crossover might typically inspire.
Read full news article
Bannari Amman Spinning Mills Ltd is Rated Sell
Bannari Amman Spinning Mills Ltd is rated 'Sell' by MarketsMOJO, with this rating last updated on 09 April 2026. However, the analysis and financial metrics discussed here reflect the stock's current position as of 07 July 2026, providing investors with an up-to-date view of the company’s fundamentals, returns, and overall outlook.
Read full news article Announcements
Compliances-Certificate under Reg. 74 (5) of SEBI (DP) Regulations 2018
03-Jul-2026 | Source : BSECertificate under Regulation 74(5) of the SEBI (Depositories Participants) Regulation 2018 for the quarter ended 30th June 2026.
Announcement under Regulation 30 (LODR)-Credit Rating
29-Jun-2026 | Source : BSERevision in Crediting Rating
Closure of Trading Window
25-Jun-2026 | Source : BSETrading Window Closure remain closed from 1.7.2026 to till 48 hours of after the declaration of Consolidated Unaudited Financial Results for the quarter ended 30.6.2026.
Corporate Actions

No Upcoming Board Meetings

Bannari Amman Spinning Mills Ltd has declared 12% dividend, ex-date: 16 Sep 22

Bannari Amman Spinning Mills Ltd has announced 5:10 stock split, ex-date: 12 Feb 21

No Bonus history available

Bannari Amman Spinning Mills Ltd has announced 10:43 rights issue, ex-date: 30 Apr 25
Quality key factors
Valuation key factors
Technicals key factors
 Technical Indicator Scale: Bearish, Mildly Bearish, Sideways, Mildly Bullish, Bullish Turned
 Shareholding Snapshot : Mar 2026
Shareholding Compare (%holding)
Non Institution
None
Held by 0 Schemes
Held by 2 FIIs (0.14%)
Murugan Enterprise Private Limited (48.49%)
None
42.31%
Quarterly Results Snapshot (Consolidated) - Mar'26 - QoQ

QoQ Growth in quarter ended Mar 2026 is 8.24% vs -10.70% in Dec 2025
QoQ Growth in quarter ended Mar 2026 is -38.94% vs -59.28% in Dec 2025
Half Yearly Results Snapshot (Consolidated) - Sep'25
Growth in half year ended Sep 2025 is -0.67% vs -5.20% in Sep 2024

Growth in half year ended Sep 2025 is 135.66% vs 160.08% in Sep 2024
Nine Monthly Results Snapshot (Consolidated) - Dec'25
YoY Growth in nine months ended Dec 2025 is -1.85% vs -1.39% in Dec 2024
YoY Growth in nine months ended Dec 2025 is 131.21% vs 158.53% in Dec 2024
Annual Results Snapshot (Consolidated) - Mar'26
YoY Growth in year ended Mar 2026 is -1.92% vs -3.92% in Mar 2025
YoY Growth in year ended Mar 2026 is 91.24% vs 132.73% in Mar 2025
About Bannari Amman Spinning Mills Ltd

Company Coordinates


