
Compare Bansal Wire Inds with Similar Stocks
Stock DNA
Iron & Steel Products
INR 4,650 Cr (Small Cap)
29.00
26
0.00%
0.38
11.41%
3.20
Total Returns (Price + Dividend) 
Bansal Wire Inds for the last several years.
Risk Adjusted Returns v/s
Returns Beta

News
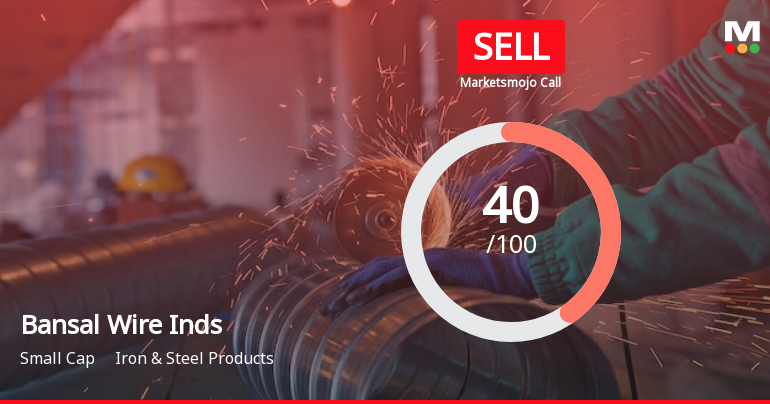
Bansal Wire Industries Ltd is Rated Sell
Bansal Wire Industries Ltd is rated 'Sell' by MarketsMOJO, with this rating last updated on 01 June 2026. However, the analysis and financial metrics discussed here reflect the stock's current position as of 08 June 2026, providing investors with an up-to-date perspective on the company’s fundamentals, valuation, financial trends, and technical outlook.
Read full news article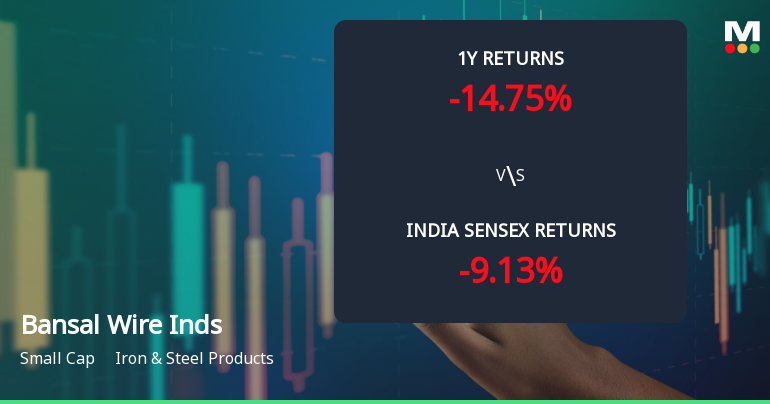
Bansal Wire Industries Ltd Technical Momentum Shifts Amid Market Volatility
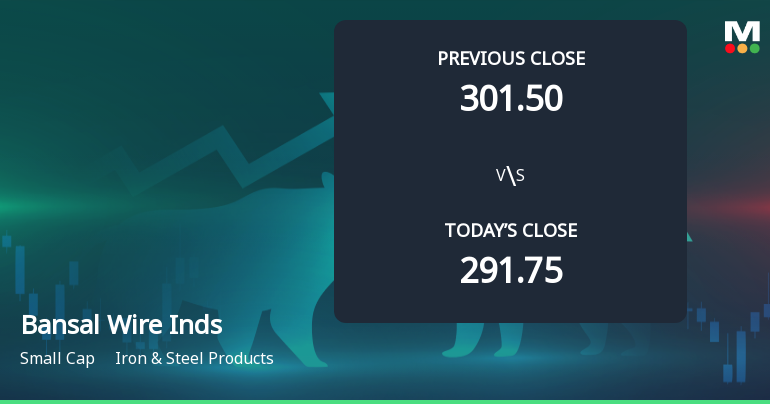
Bansal Wire Industries Ltd, a small-cap player in the Iron & Steel Products sector, has experienced a notable shift in its technical momentum, moving from a mildly bullish to a mildly bearish stance. This change comes amid a 3.01% decline in the stock price on 2 Jun 2026, reflecting broader market pressures and sector-specific challenges. An in-depth analysis of key technical indicators such as MACD, RSI, moving averages, and Bollinger Bands reveals a nuanced picture of the stock’s near-term outlook.
Read full news article Announcements
Disclosure Under Regulation 30 Of SEBI(Listing Obligations And Disclosure Requirements) Regulations 2015
18-May-2026 | Source : BSEBansal Wire Industries Limited has informed the exchange regarding disclosure under Regulation 30 of SEBI (Listing Obligations and Disclosure Requirements) Regulations 2015 with respect to appeal order received from GST Appellate Athority for the financial year 2023-24 in furtherance to our letter dated January 8 2026
Announcement under Regulation 30 (LODR)-Analyst / Investor Meet - Intimation
16-May-2026 | Source : BSEBansal Wire Industries Limited has informed the Exchange regarding the Schedule of Investors/Analysts meet to be held on Thursday May 21 2026
Disclosures under Reg. 29(1) of SEBI (SAST) Regulations 2011
12-May-2026 | Source : BSEThe Exchange has received the disclosure under Regulation 29(1) of SEBI (Substantial Acquisition of Shares & Takeovers) Regulations 2011 for Invesco Mutual Fund
Corporate Actions

No Upcoming Board Meetings

No Dividend history available

No Splits history available

No Bonus history available

No Rights history available
Quality key factors
Valuation key factors
Technicals key factors
 Technical Indicator Scale: Bearish, Mildly Bearish, Sideways, Mildly Bullish, Bullish Turned
 Shareholding Snapshot : Mar 2026
Shareholding Compare (%holding)
Promoters
None
Held by 9 Schemes (13.21%)
Held by 15 FIIs (0.88%)
Anita Gupta (19.74%)
Invesco India Equity Savings Fund (4.98%)
3.42%
Quarterly Results Snapshot (Consolidated) - Mar'26 - QoQ

QoQ Growth in quarter ended Mar 2026 is 10.43% vs -2.50% in Dec 2025

QoQ Growth in quarter ended Mar 2026 is -7.40% vs 12.92% in Dec 2025
Half Yearly Results Snapshot (Consolidated) - Sep'25
Growth in half year ended Sep 2025 is 21.43% vs 42.65% in Sep 2024
Growth in half year ended Sep 2025 is 11.14% vs 97.01% in Sep 2024
Nine Monthly Results Snapshot (Consolidated) - Dec'25
YoY Growth in nine months ended Dec 2025 is 17.78% vs 46.07% in Dec 2024
YoY Growth in nine months ended Dec 2025 is 8.40% vs 121.93% in Dec 2024
Annual Results Snapshot (Consolidated) - Mar'26
YoY Growth in year ended Mar 2026 is 18.61% vs 42.22% in Mar 2025
YoY Growth in year ended Mar 2026 is 11.28% vs 96.44% in Mar 2025
About Bansal Wire Industries Ltd

Company Coordinates


