
Compare Banswara Syntex with Similar Stocks
Dashboard
With a growth in Operating Profit of 12.48%, the company declared Very Positive results in Mar 26
- The company has declared positive results for the last 2 consecutive quarters
- PAT(Q) At Rs 18.17 cr has Grown at 184.1% (vs previous 4Q average)
- ROCE(HY) Highest at 8.80%
- OPERATING PROFIT TO INTEREST(Q) Highest at 4.10 times
With ROCE of 7.2, it has a Attractive valuation with a 0.9 Enterprise value to Capital Employed
Majority shareholders : Promoters
Stock DNA
Garments & Apparels
INR 454 Cr (Micro Cap)
12.00
23
0.79%
0.80
6.48%
0.75
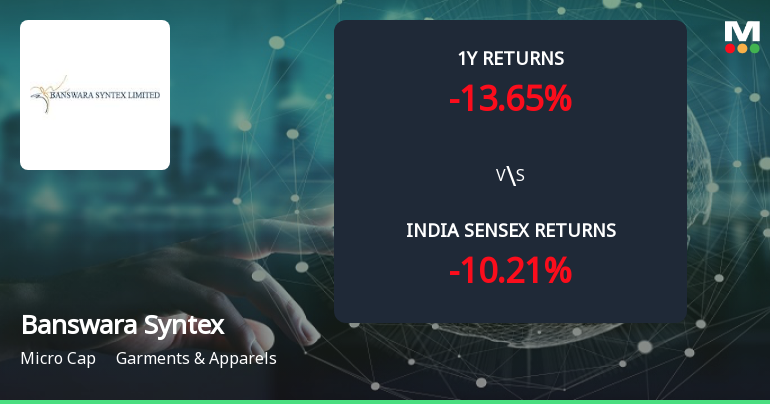
Total Returns (Price + Dividend) 
Latest dividend: 1 per share ex-dividend date: Jul-23-2025
Risk Adjusted Returns v/s
Returns Beta

News
Banswara Syntex Ltd Forms Golden Cross Amid Mixed Technical Signals and Micro-Cap Constraints
The 50-day moving average for Banswara Syntex Ltd has crossed above the 200-day moving average, creating a golden cross on 10 Jun 2026. Yet, the stock declined 2.10% on the day of the crossover, and monthly momentum indicators show a nuanced picture. This golden cross is technically valid but contextually complicated, warranting a closer look at the broader technical and fundamental landscape.
Read full news article
Banswara Syntex Ltd Upgraded to Buy on Improved Technicals and Valuation
Banswara Syntex Ltd, a micro-cap player in the garments and apparels sector, has seen its investment rating upgraded from Hold to Buy as of 9 June 2026. This upgrade follows a comprehensive reassessment across four key parameters: quality, valuation, financial trend, and technicals. The company’s recent operational performance, valuation metrics, and technical indicators have collectively contributed to a more favourable outlook, signalling renewed investor interest amid a challenging market backdrop.
Read full news article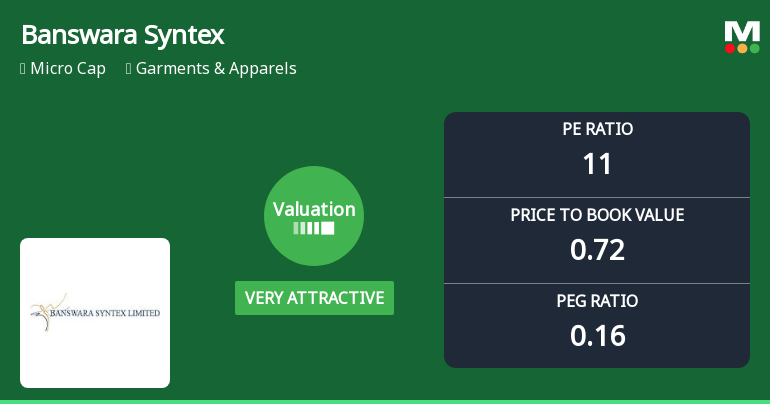
Banswara Syntex Ltd Valuation Shifts Signal Renewed Price Attractiveness
Banswara Syntex Ltd has witnessed a significant improvement in its valuation parameters, shifting from an attractive to a very attractive grade. This change reflects a notable reappraisal of its price-to-earnings (P/E) and price-to-book value (P/BV) ratios relative to its historical averages and industry peers, positioning the micro-cap garment and apparel company as a compelling consideration for investors seeking value in a competitive sector.
Read full news article Announcements
Announcement under Regulation 30 (LODR)-Earnings Call Transcript
26-May-2026 | Source : BSETranscript of Earning Call held on 20th May 2026.
Announcement under Regulation 30 (LODR)-Analyst / Investor Meet - Outcome
20-May-2026 | Source : BSEAudio recording of earnings call held on 20th May 2026
Announcement under Regulation 30 (LODR)-Newspaper Publication
20-May-2026 | Source : BSENewspaper publication of Audited Financial Results for 4th Quarter and Financial Year ended on 31.03.2026.
Corporate Actions

No Upcoming Board Meetings

Banswara Syntex Ltd has declared 20% dividend, ex-date: 23 Jul 25

Banswara Syntex Ltd has announced 5:10 stock split, ex-date: 08 Sep 22

Banswara Syntex Ltd has announced 1:2 bonus issue, ex-date: 17 Aug 06

No Rights history available
Quality key factors
Valuation key factors
Technicals key factors
 Technical Indicator Scale: Bearish, Mildly Bearish, Sideways, Mildly Bullish, Bullish Turned
 Shareholding Snapshot : Mar 2026
Shareholding Compare (%holding)
Promoters
None
Held by 0 Schemes
Held by 4 FIIs (7.91%)
Shaleen Toshniwal (12.51%)
Unico Global Opportunites Fund Limited (3.85%)
27.33%
Quarterly Results Snapshot (Consolidated) - Mar'26 - QoQ

QoQ Growth in quarter ended Mar 2026 is 7.56% vs -1.38% in Dec 2025

QoQ Growth in quarter ended Mar 2026 is -17.93% vs 97.74% in Dec 2025
Half Yearly Results Snapshot (Consolidated) - Sep'25
Growth in half year ended Sep 2025 is 6.05% vs -0.74% in Sep 2024
Growth in half year ended Sep 2025 is -7.00% vs -67.18% in Sep 2024
Nine Monthly Results Snapshot (Consolidated) - Dec'25
YoY Growth in nine months ended Dec 2025 is 4.01% vs 3.47% in Dec 2024
YoY Growth in nine months ended Dec 2025 is 21.07% vs -39.86% in Dec 2024
Annual Results Snapshot (Consolidated) - Mar'26
YoY Growth in year ended Mar 2026 is 4.93% vs 2.27% in Mar 2025
YoY Growth in year ended Mar 2026 is 40.79% vs -37.65% in Mar 2025
About Banswara Syntex Ltd

Company Coordinates


