
Compare Battalion Oil Corp. with Similar Stocks
Total Returns (Price + Dividend) 
TimePeriod
Price Return
Dividend Return
Total Return
3 Months
103.62%
0%
103.62%
6 Months
-15.36%
0%
-15.36%
1 Year
-49.82%
0%
-49.82%
2 Years
-53.78%
0%
-53.78%
3 Years
-79.8%
0%
-79.8%
4 Years
-77.8%
0%
-77.8%
5 Years
-69.91%
0%
-69.91%
Battalion Oil Corp. for the last several years.
Risk Adjusted Returns v/s
News
Battalion Oil Corp. Experiences Revision in Its Stock Evaluation Amid Financial Trends
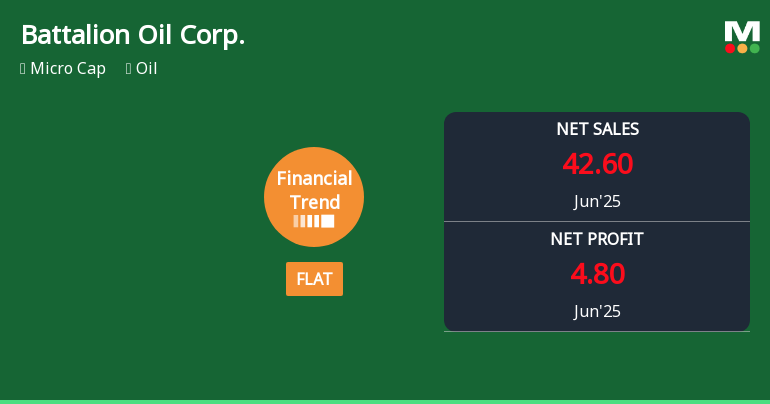
Battalion Oil Corp. has reported flat financial performance for the quarter ending June 2025, showcasing strengths such as a strong cash position and a low debt-equity ratio. However, challenges include low operating cash flow, rising raw material costs, and significant stock volatility compared to the S&P 500.
Read full news article Announcements

No announcement available
Corporate Actions
No corporate action available
Quality key factors
Factor
Value
Sales Growth (5y)
0.42%
EBIT Growth (5y)
16.17%
EBIT to Interest (avg)
2.70
Debt to EBITDA (avg)
3.63
Net Debt to Equity (avg)
-190.15
Sales to Capital Employed (avg)
0.60
Tax Ratio
0
Dividend Payout Ratio
0
Pledged Shares
0
Institutional Holding
85.56%
ROCE (avg)
31.03%
ROE (avg)
0.42%
Valuation key factors
Factor
Value
P/E Ratio
NA (Loss Making)
Industry P/E
Price to Book Value
-12.52
EV to EBIT
36.79
EV to EBITDA
5.70
EV to Capital Employed
1.07
EV to Sales
1.87
PEG Ratio
NA
Dividend Yield
NA
ROCE (Latest)
2.91%
ROE (Latest)
Negative BV
Technicals key factors
Indicator
Weekly
Monthly
MACD
Bullish
Mildly Bullish
RSI
No Signal
Bearish
Bollinger Bands
Mildly Bullish
Mildly Bullish
Moving Averages
Bullish (Daily)
KST
Bullish
Mildly Bullish
Dow Theory
No Trend
No Trend
OBV
No Trend
No Trend
 Technical Indicator Scale: Bearish, Mildly Bearish, Sideways, Mildly Bullish, Bullish Turned
 Shareholding Snapshot : Sep 2025
Shareholding Compare (%holding)
Majority shareholders
Strategic Entities
Domestic Funds
Held in 6 Schemes (3.27%)
Foreign Institutions
Held by 25 Foreign Institutions (3.95%)
Strategic Entities with highest holding
Highest Public shareholder
Quarterly Results Snapshot (Consolidated) - Jun'25 - QoQ
Jun'25
Mar'25
Change(%)
Net Sales
42.60
47.40
-10.13%
Operating Profit (PBDIT) excl Other Income
13.50
16.40
-17.68%
Interest
6.60
6.70
-1.49%
Exceptional Items
7.20
11.80
-38.98%
Consolidate Net Profit
4.80
6.00
-20.00%
Operating Profit Margin (Excl OI)
-9.10%
69.70%
-7.88%
USD in Million.

Net Sales
QoQ Growth in quarter ended Jun 2025 is -10.13% vs -4.24% in Mar 2025
Consolidated Net Profit
QoQ Growth in quarter ended Jun 2025 is -20.00% vs 127.03% in Mar 2025
Annual Results Snapshot (Consolidated) - Dec'24
Dec'24
Dec'23
Change(%)
Net Sales
193.20
218.50
-11.58%
Operating Profit (PBDIT) excl Other Income
59.00
71.90
-17.94%
Interest
29.00
33.30
-12.91%
Exceptional Items
-2.80
21.90
-112.79%
Consolidate Net Profit
-31.90
-3.00
-963.33%
Operating Profit Margin (Excl OI)
31.50%
70.10%
-3.86%
USD in Million.

Net Sales
YoY Growth in year ended Dec 2024 is -11.58% vs -38.86% in Dec 2023
Consolidated Net Profit
YoY Growth in year ended Dec 2024 is -963.33% vs -116.22% in Dec 2023
About Battalion Oil Corp.

Battalion Oil Corp.
Oil
Battalion Oil Corp, formerly Halcon Resources Corporation, is an independent energy company. The Company is focused on the acquisition, production, exploration and development of onshore liquids-rich oil and natural gas assets in the United States. The Company operates in one segment, which focuses on oil and natural gas acquisition, production, exploration and development. The Company’s principal properties consist of leasehold interests in developed and undeveloped oil and natural gas properties and the reserves associated with these properties. The Company has working interests in approximately 56,900 net acres in the Delaware Basin in Pecos, Reeves, Ward and Winkler Counties, Texas. It has approximately 104 operated wells producing in this area in addition to minor working interests in approximately 19 non-operated wells.
Company Coordinates
Company Details
1000 Louisiana St Ste 1500 , HOUSTON TX : 77002-5018


Registrar Details
InfinHub Market Technologies FZ-LLC, Building-2, Unit 112, Dubai Internet City, Dubai, United Arab Emirates
GET THE MARKETSMOJO APP


Company
Stocks
Portfolio


"Investment in securities markets are subject to market risk. Read all the related documents carefully before investing."