
Compare Bayer CropSci. with Similar Stocks
Stock DNA
Pesticides & Agrochemicals
INR 19,424 Cr (Small Cap)
28.00
29
2.87%
-0.19
22.07%
6.27
Total Returns (Price + Dividend) 
Latest dividend: 90 per share ex-dividend date: Nov-14-2025
Risk Adjusted Returns v/s
Returns Beta

News
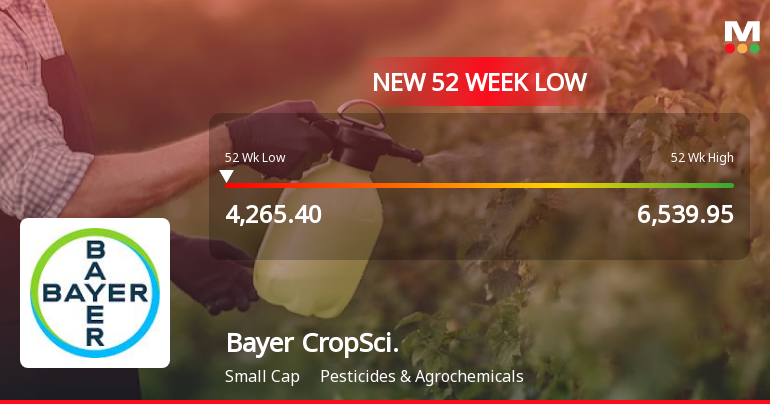
Bayer CropScience Ltd Falls to 52-Week Low of Rs 4265.4 as Sell-Off Deepens
A sharp decline over the past two sessions has dragged Bayer CropScience Ltd to a fresh 52-week low of Rs 4265.4 on 8 Jun 2026, marking a 3.25% drop in just 48 hours amid broader sector weakness and persistent selling pressure.
Read full news article
Bayer CropScience Ltd is Rated Sell
Bayer CropScience Ltd is rated 'Sell' by MarketsMOJO, with this rating last updated on 18 May 2026. While the rating change occurred on that date, the analysis and financial metrics discussed here reflect the stock's current position as of 30 May 2026, providing investors with the latest insights into the company’s performance and outlook.
Read full news article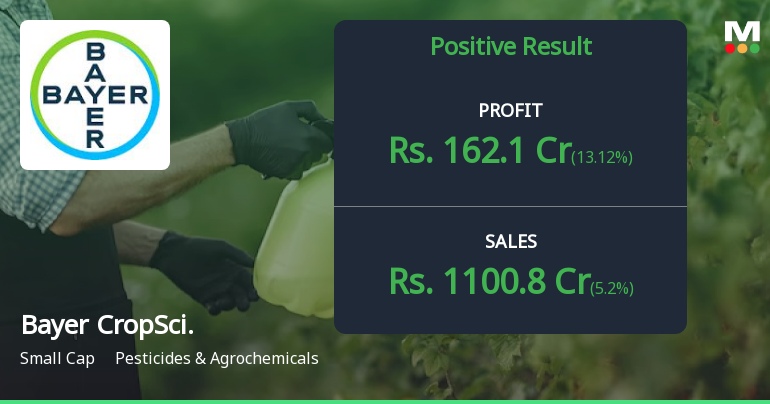
Bayer CropScience Q4 FY26: Margin Recovery Masks Deeper Growth Concerns
Bayer CropScience Ltd., a leading player in India's agrochemicals sector with a market capitalisation of ₹20,927 crores, reported net profit of ₹162.10 crores for Q4 FY26, marking a 13.12% year-on-year increase but a significant 69.38% sequential improvement from the previous quarter. Despite the profitability recovery, the company's shares have struggled, declining 17.98% over the past year and currently trading at ₹4,656.45, down 28.80% from their 52-week high of ₹6,539.95.
Read full news article Announcements
Announcement under Regulation 30 (LODR)-Newspaper Publication
28-May-2026 | Source : BSEIn terms of Regulation 47 of SEBI Listing Regulations 2015 please find attached the newspaper publication for the audited financial results of the Company for the financial year ended March 31 2026.
Compliances-Reg.24(A)-Annual Secretarial Compliance
27-May-2026 | Source : BSEAttached Annual Secretarial Compliance Report for the financial year ended March 31 2026.
Announcement under Regulation 30 (LODR)-Press Release / Media Release
26-May-2026 | Source : BSEWe herewith attach a copy of Press Release that is being issued by the Company today in connection with the captioned subject.
Corporate Actions

No Upcoming Board Meetings

Bayer CropScience Ltd has declared 900% dividend, ex-date: 14 Nov 25

No Splits history available

No Bonus history available

No Rights history available
Quality key factors
Valuation key factors
Technicals key factors
 Technical Indicator Scale: Bearish, Mildly Bearish, Sideways, Mildly Bullish, Bullish Turned
 Shareholding Snapshot : Mar 2026
Shareholding Compare (%holding)
Promoters
None
Held by 26 Schemes (9.05%)
Held by 144 FIIs (3.89%)
Bayer Vapi Private Limited (17.89%)
Quant Mutual Fund - Quant Small Cap Fund (2.31%)
8.41%
Quarterly Results Snapshot (Standalone) - Mar'26 - YoY

YoY Growth in quarter ended Mar 2026 is 5.20% vs 32.07% in Mar 2025
YoY Growth in quarter ended Mar 2026 is 13.12% vs 49.27% in Mar 2025
Half Yearly Results Snapshot (Standalone) - Sep'25

Growth in half year ended Sep 2025 is 2.94% vs 0.36% in Sep 2024
Growth in half year ended Sep 2025 is 10.47% vs -29.18% in Sep 2024
Nine Monthly Results Snapshot (Standalone) - Dec'25
YoY Growth in nine months ended Dec 2025 is 3.34% vs 2.66% in Dec 2024
YoY Growth in nine months ended Dec 2025 is 24.11% vs -34.10% in Dec 2024
Annual Results Snapshot (Standalone) - Mar'26
YoY Growth in year ended Mar 2026 is 3.68% vs 7.19% in Mar 2025
YoY Growth in year ended Mar 2026 is 21.34% vs -23.30% in Mar 2025
About Bayer CropScience Ltd

Company Coordinates


