
Compare Bazel Internatio with Similar Stocks
Stock DNA
Non Banking Financial Company (NBFC)
INR 18 Cr (Micro Cap)
26.00
21
0.00%
0.19
1.09%
0.29
Total Returns (Price + Dividend) 
Bazel Internatio for the last several years.
Risk Adjusted Returns v/s
Returns Beta

News
Bazel International Ltd Upgraded to Sell on Technical Improvements Despite Weak Fundamentals
Bazel International Ltd, a micro-cap player in the Non Banking Financial Company (NBFC) sector, has seen its investment rating upgraded from Strong Sell to Sell as of 9 June 2026. This change reflects a nuanced shift in the company’s technical outlook despite persistent fundamental challenges and weak financial trends. Investors should carefully consider the interplay of quality, valuation, financial performance, and technical indicators before making decisions.
Read full news article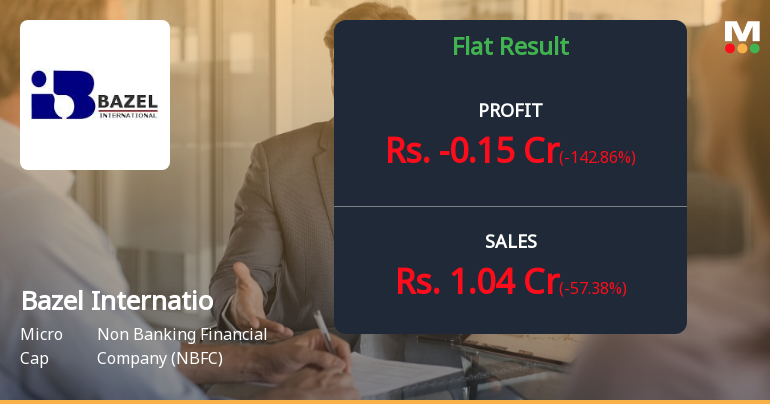
Bazel International Q4 FY26: Quarterly Loss Raises Serious Questions About NBFC's Viability
Bazel International Ltd., a micro-cap non-banking financial company registered with the Reserve Bank of India, reported a consolidated net loss of ₹0.15 crores for Q4 FY26 (March 2026 quarter), marking a dramatic reversal from the ₹0.35 crores profit posted in Q4 FY25. The loss represents a sequential deterioration of 171.43% from the ₹0.21 crores profit in Q3 FY26, triggering fresh concerns about the company's operational sustainability. The stock, trading at ₹19.52 with a market capitalisation of just ₹19.00 crores, has plunged 50.36% over the past year, significantly underperforming both the Sensex and its NBFC sector peers.
Read full news article
Bazel International Ltd Downgraded to Strong Sell Amid Weak Fundamentals and Bearish Technicals
Bazel International Ltd, a micro-cap player in the Non Banking Financial Company (NBFC) sector, has been downgraded from a Sell to a Strong Sell rating as of 19 May 2026. This revision reflects deteriorating technical indicators, stagnant financial performance, and weak long-term fundamentals, signalling heightened risk for investors amid a challenging market environment.
Read full news article Announcements
Announcement under Regulation 30 (LODR)-Newspaper Publication
01-Jun-2026 | Source : BSENewspaper Clippings of the Audited Financial Results for the Quarter and year ended on 31st March 2026
Revised Outcome Of Board Meeting 28 May 2026
29-May-2026 | Source : BSEA/a
Revised Outcome Of Board Meeting Held On 28 May 2026
29-May-2026 | Source : BSERevised Outcome of Board Meeting held on 28 May 2026
Corporate Actions

No Upcoming Board Meetings

No Dividend history available

No Splits history available

Bazel International Ltd has announced 1:1 bonus issue, ex-date: 18 Feb 26

No Rights history available
Quality key factors
Valuation key factors
Technicals key factors
 Technical Indicator Scale: Bearish, Mildly Bearish, Sideways, Mildly Bullish, Bullish Turned
 Shareholding Snapshot : Jun 2026
Shareholding Compare (%holding)
Non Institution
None
Held by 0 Schemes
Held by 0 FIIs
Rajendra Prasad Yadav (0.03%)
Durgesh Merchants Limited (16.79%)
21.09%
Quarterly Results Snapshot (Consolidated) - Mar'26 - YoY

YoY Growth in quarter ended Mar 2026 is -57.38% vs -86.28% in Mar 2025

YoY Growth in quarter ended Mar 2026 is -142.86% vs -2.78% in Mar 2025
Half Yearly Results Snapshot (Standalone) - Sep'25
Growth in half year ended Sep 2025 is 37.97% vs -37.30% in Sep 2024
Growth in half year ended Sep 2025 is -1.02% vs 136.16% in Sep 2024
Nine Monthly Results Snapshot (Standalone) - Dec'25
YoY Growth in nine months ended Dec 2025 is 41.88% vs -38.42% in Dec 2024
YoY Growth in nine months ended Dec 2025 is 24.17% vs 164.86% in Dec 2024
Annual Results Snapshot (Consolidated) - Mar'26
YoY Growth in year ended Mar 2026 is 37.38% vs -81.96% in Mar 2025
YoY Growth in year ended Mar 2026 is 380.00% vs -58.33% in Mar 2025
About Bazel International Ltd

Company Coordinates


