
Compare BCL Industries with Similar Stocks
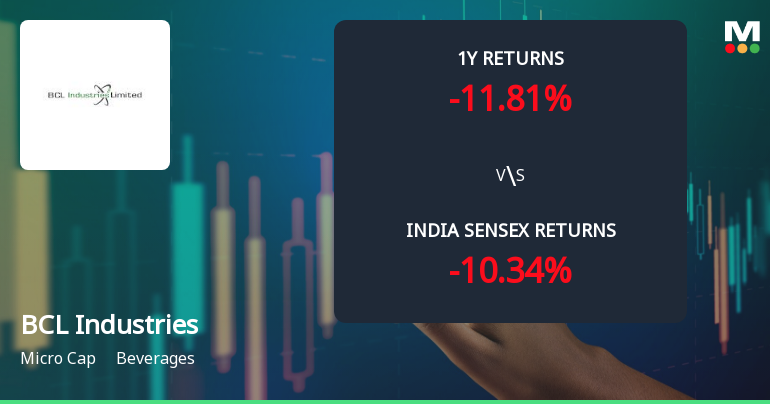
Total Returns (Price + Dividend) 
Latest dividend: 0.26 per share ex-dividend date: Sep-19-2025
Risk Adjusted Returns v/s
Returns Beta

News
BCL Industries Ltd Technical Momentum Shifts Amid Mixed Market Signals
BCL Industries Ltd, a micro-cap player in the beverages sector, has exhibited a notable shift in its technical momentum, transitioning from a mildly bearish stance to a sideways trend. Despite a recent upgrade in daily price action, mixed signals from key technical indicators such as MACD, RSI, and moving averages suggest a complex outlook for investors navigating this stock’s near-term trajectory.
Read full news article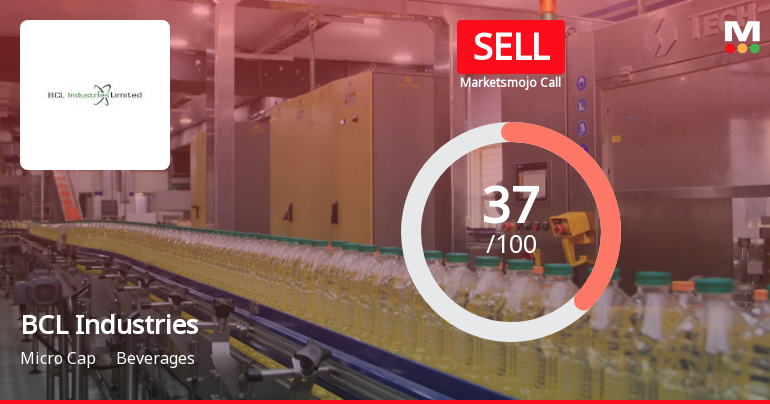
BCL Industries Ltd is Rated Sell
BCL Industries Ltd is rated 'Sell' by MarketsMOJO, with this rating last updated on 14 February 2026. However, the analysis and financial metrics discussed here reflect the stock's current position as of 09 June 2026, providing investors with an up-to-date view of the company’s fundamentals, valuation, financial trends, and technical outlook.
Read full news article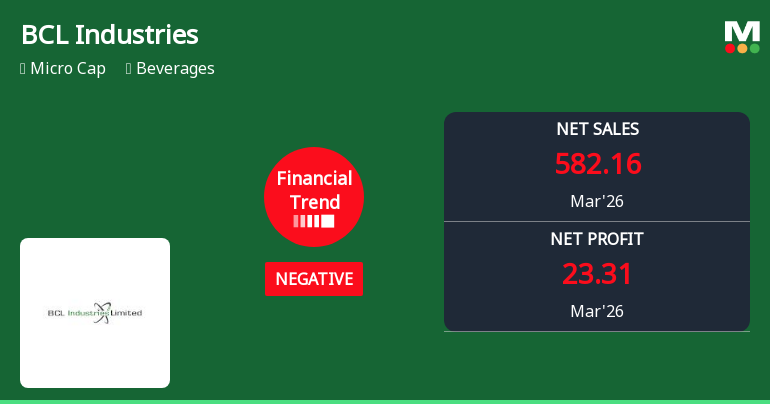
BCL Industries Ltd Reports Negative Financial Trend Amidst Declining Quarterly Performance
BCL Industries Ltd, a micro-cap player in the beverages sector, has witnessed a marked deterioration in its financial trend during the quarter ended March 2026. Despite a robust growth in profit after tax over the last six months, the company’s latest quarterly results reveal significant contraction in key metrics, signalling challenges ahead for investors and stakeholders alike.
Read full news article Announcements
Response To The Exchange Query
09-Jun-2026 | Source : BSEResponse to the Exchange Query
Clarification sought from BCL Industries Ltd
09-Jun-2026 | Source : BSEThe Exchange has sought clarification from BCL Industries Ltd on June 9 2026 with reference to Movement in Volume.
The reply is awaited.
Announcement under Regulation 30 (LODR)-Analyst / Investor Meet - Intimation
09-Jun-2026 | Source : BSEIntimation of schedule of Investor meeting
Corporate Actions

No Upcoming Board Meetings

BCL Industries Ltd has declared 26% dividend, ex-date: 19 Sep 25

BCL Industries Ltd has announced 1:10 stock split, ex-date: 27 Oct 23

No Bonus history available

No Rights history available
Quality key factors
Valuation key factors
Technicals key factors
 Technical Indicator Scale: Bearish, Mildly Bearish, Sideways, Mildly Bullish, Bullish Turned
 Shareholding Snapshot : Mar 2026
Shareholding Compare (%holding)
Promoters
4.3846
Held by 0 Schemes
Held by 12 FIIs (0.42%)
Sunita Mittal (16.59%)
Sangeetha S (1.13%)
33.29%
Quarterly Results Snapshot (Consolidated) - Mar'26 - QoQ

QoQ Growth in quarter ended Mar 2026 is -19.83% vs 5.02% in Dec 2025
QoQ Growth in quarter ended Mar 2026 is -27.47% vs 11.21% in Dec 2025
Half Yearly Results Snapshot (Consolidated) - Sep'25
Growth in half year ended Sep 2025 is 9.32% vs 49.22% in Sep 2024
Growth in half year ended Sep 2025 is 18.40% vs 37.45% in Sep 2024
Nine Monthly Results Snapshot (Consolidated) - Dec'25
YoY Growth in nine months ended Dec 2025 is 5.60% vs 36.62% in Dec 2024

YoY Growth in nine months ended Dec 2025 is 31.94% vs 3.39% in Dec 2024
Annual Results Snapshot (Consolidated) - Mar'26
YoY Growth in year ended Mar 2026 is -0.83% vs 32.22% in Mar 2025
YoY Growth in year ended Mar 2026 is 21.07% vs 5.17% in Mar 2025
About BCL Industries Ltd

Company Coordinates


