
Compare Bedmutha Indus. with Similar Stocks
Stock DNA
Iron & Steel Products
INR 348 Cr (Micro Cap)
54.00
24
0.00%
1.23
4.28%
2.30
Total Returns (Price + Dividend) 
Bedmutha Indus. for the last several years.
Risk Adjusted Returns v/s
Returns Beta

News
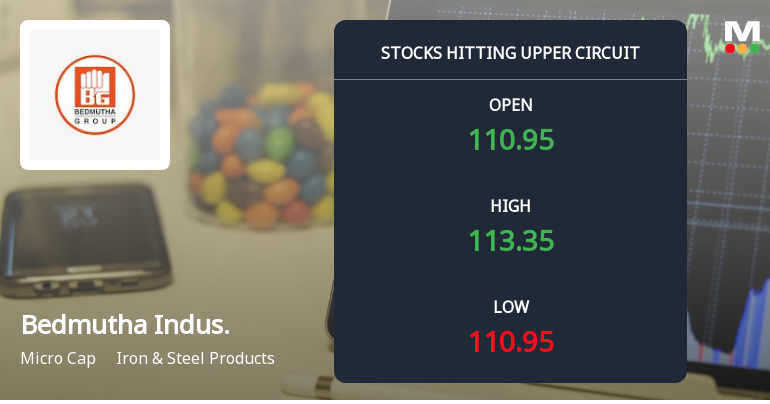
Bedmutha Industries Ltd Locks at Upper Circuit With 5% Gain — Buyers Queue, Sellers Absent
At Rs 112.23, the buying was done — not because demand dried up, but because the exchange wouldn't let the stock go any higher. Bedmutha Industries Ltd locked at its upper circuit of 5% on 27 Jul 2026, with buyers queuing and no sellers willing to part with shares.
Read full news article
Bedmutha Industries Ltd is Rated Sell
Bedmutha Industries Ltd is rated 'Sell' by MarketsMOJO, with this rating last updated on 30 May 2026. However, the analysis and financial metrics discussed here reflect the stock's current position as of 25 July 2026, providing investors with an up-to-date view of the company’s fundamentals, returns, and market performance.
Read full news article
Bedmutha Industries Ltd is Rated Sell
Bedmutha Industries Ltd is rated 'Sell' by MarketsMOJO, with this rating last updated on 30 May 2026. However, the analysis and financial metrics presented here reflect the stock's current position as of 14 July 2026, providing investors with an up-to-date view of the company’s fundamentals, valuation, financial trends, and technical outlook.
Read full news article Announcements
Announcement under Regulation 30 (LODR)-Change in Management
22-Jul-2026 | Source : BSEMr Rakesh Kankariya Company secretary and compliance officer ( KMP) of the Company has tendered his resignation today 22nd July 2026. We wish to inform you that he will be relieved from his duties w.e.f close of business hours on 10th July 2026
Compliances-Certificate under Reg. 74 (5) of SEBI (DP) Regulations 2018
05-Jul-2026 | Source : BSEWith reference to subject matter please find attached certificate received from RTA of the Company.
Closure of Trading Window
23-Jun-2026 | Source : BSEPlease find attached disclosure for closure of trading window for the June quarter Starting from 1st July 2026 .
Corporate Actions

No Upcoming Board Meetings

No Dividend history available

No Splits history available

No Bonus history available

No Rights history available
Quality key factors
Valuation key factors
Technicals key factors
 Technical Indicator Scale: Bearish, Mildly Bearish, Sideways, Mildly Bullish, Bullish Turned
 Shareholding Snapshot : Jun 2026
Shareholding Compare (%holding)
Promoters
94.9921
Held by 0 Schemes
Held by 0 FIIs
Ajay Kachardas Vedmutha (10.78%)
K Fx Services Pvt Ltd (18.31%)
19.42%
Quarterly Results Snapshot (Consolidated) - Mar'26 - YoY

YoY Growth in quarter ended Mar 2026 is 54.63% vs 22.78% in Mar 2025
YoY Growth in quarter ended Mar 2026 is 606.76% vs -69.33% in Mar 2025
Half Yearly Results Snapshot (Consolidated) - Sep'25
Growth in half year ended Sep 2025 is 36.48% vs 26.38% in Sep 2024

Growth in half year ended Sep 2025 is -120.49% vs 168.05% in Sep 2024
Nine Monthly Results Snapshot (Consolidated) - Dec'25
YoY Growth in nine months ended Dec 2025 is 34.33% vs 31.77% in Dec 2024
YoY Growth in nine months ended Dec 2025 is -135.74% vs 60.21% in Dec 2024
Annual Results Snapshot (Consolidated) - Mar'26
YoY Growth in year ended Mar 2026 is 39.78% vs 29.23% in Mar 2025
YoY Growth in year ended Mar 2026 is -73.81% vs 18.53% in Mar 2025
About Bedmutha Industries Ltd

Company Coordinates


