
Compare Bedmutha Indus. with Similar Stocks
Stock DNA
Iron & Steel Products
INR 348 Cr (Micro Cap)
54.00
9
0.00%
1.23
4.28%
2.30
Total Returns (Price + Dividend) 
Bedmutha Indus. for the last several years.
Risk Adjusted Returns v/s
Returns Beta

News

Bedmutha Industries Ltd is Rated Sell
Bedmutha Industries Ltd is rated 'Sell' by MarketsMOJO, with this rating last updated on 30 May 2026. However, the analysis and financial metrics discussed here reflect the stock's current position as of 11 June 2026, providing investors with the latest insights into the company’s performance and outlook.
Read full news article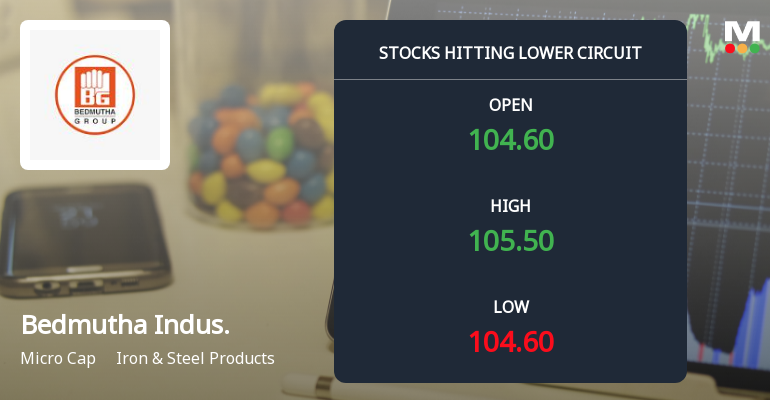
Bedmutha Industries Ltd Locks at Lower Circuit With 5% Loss — Sellers Queue, No Buyers in Sight
At Rs 102.60, sellers were still queuing — but there were no buyers willing to take the other side. Bedmutha Industries Ltd locked at its lower circuit of 5% on 9 Jun 2026, with unfilled sell orders and a frozen price, reflecting persistent selling pressure in a micro-cap stock with limited liquidity.
Read full news article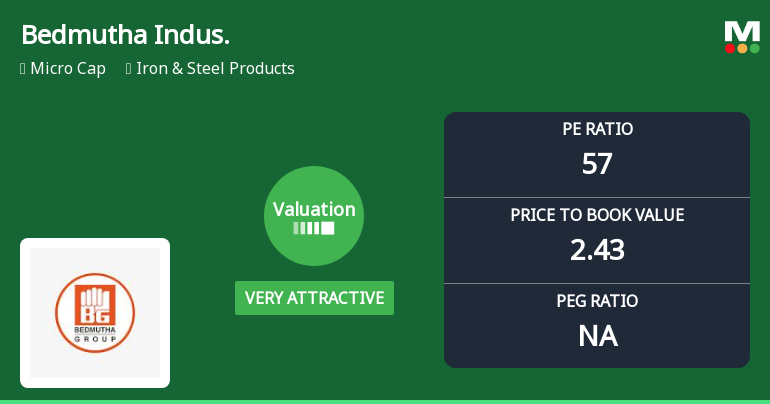
Bedmutha Industries Ltd Valuation Shifts to Very Attractive Amid Mixed Returns
Bedmutha Industries Ltd, a micro-cap player in the Iron & Steel Products sector, has seen a notable shift in its valuation parameters, moving from an attractive to a very attractive rating. Despite a recent day decline of 1.21%, the company’s price-to-earnings (P/E) and price-to-book value (P/BV) ratios suggest a compelling investment case when compared with peers and historical benchmarks.
Read full news article Announcements
Announcement under Regulation 30 (LODR)-Newspaper Publication
31-May-2026 | Source : BSEPlease find attached the extracts of the Audited financial results as published in the newspaper on 30th May 2026
Audited (Standalone And Consolidated) Financial Results Along With The Auditors Reports For The Quarter And Year Ended March 31 2026
28-May-2026 | Source : BSEPlease find attached financial results of the company as stated in subject matter.
Board Meeting Intimation for The Quarterly Board Meeting To Approve Financial Results
21-May-2026 | Source : BSEBedmutha Industries Ltdhas informed BSE that the meeting of the Board of Directors of the Company is scheduled on 28/05/2026 inter alia to consider and approve Audited Financial results for FY 2026
Corporate Actions

No Upcoming Board Meetings

No Dividend history available

No Splits history available

No Bonus history available

No Rights history available
Quality key factors
Valuation key factors
Technicals key factors
 Technical Indicator Scale: Bearish, Mildly Bearish, Sideways, Mildly Bullish, Bullish Turned
 Shareholding Snapshot : Mar 2026
Shareholding Compare (%holding)
Promoters
95.0602
Held by 0 Schemes
Held by 0 FIIs
Ajay Kachardas Vedmutha (10.78%)
K Fx Services Pvt Ltd (18.31%)
19.31%
Quarterly Results Snapshot (Consolidated) - Mar'26 - YoY

YoY Growth in quarter ended Mar 2026 is 54.63% vs 22.78% in Mar 2025
YoY Growth in quarter ended Mar 2026 is 606.76% vs -69.33% in Mar 2025
Half Yearly Results Snapshot (Consolidated) - Sep'25
Growth in half year ended Sep 2025 is 36.48% vs 26.38% in Sep 2024

Growth in half year ended Sep 2025 is -120.49% vs 168.05% in Sep 2024
Nine Monthly Results Snapshot (Consolidated) - Dec'25
YoY Growth in nine months ended Dec 2025 is 34.33% vs 31.77% in Dec 2024
YoY Growth in nine months ended Dec 2025 is -135.74% vs 60.21% in Dec 2024
Annual Results Snapshot (Consolidated) - Mar'26
YoY Growth in year ended Mar 2026 is 39.78% vs 29.23% in Mar 2025
YoY Growth in year ended Mar 2026 is -73.81% vs 18.53% in Mar 2025
About Bedmutha Industries Ltd

Company Coordinates


