
Compare Berger Paints with Similar Stocks
Dashboard
High Management Efficiency with a high ROE of 19.62%
Company has a Debt to Equity ratio (avg) of 0.08 times
Poor long term growth as Operating profit has grown by an annual rate 8.31% of over the last 5 years
Flat results in Mar 26
With ROE of 16.9, it has a Fair valuation with a 8.4 Price to Book Value
Majority shareholders : Promoters
Underperformed the market in the last 1 year
With its market cap of Rs 58,300 cr, it is the second biggest company in the sector (behind Asian Paints)and constitutes 16.51% of the entire sector
Total Returns (Price + Dividend) 
Latest dividend: 3.8033216783216783 per share ex-dividend date: Aug-05-2025
Risk Adjusted Returns v/s
Returns Beta

News
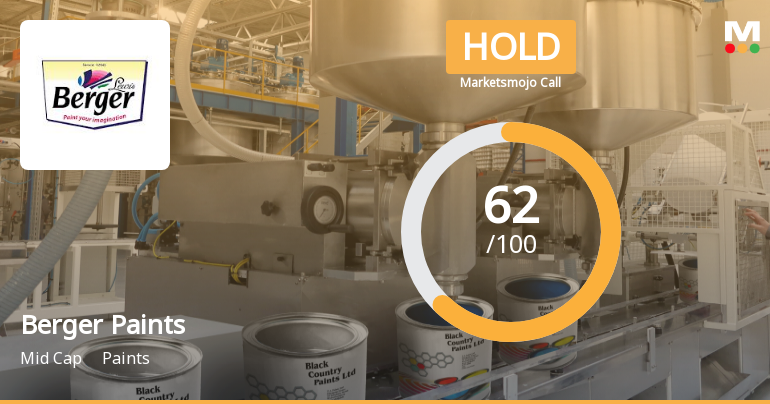
Berger Paints India Ltd Upgraded to Hold on Improved Technicals and Fair Valuation
Berger Paints India Ltd has seen its investment rating upgraded from Sell to Hold, reflecting a notable improvement in technical indicators and a shift to fair valuation metrics. Despite recent flat financial performance and underwhelming returns relative to the broader market, the company’s enhanced technical outlook and reasonable valuation have prompted a reassessment of its investment stance.
Read full news article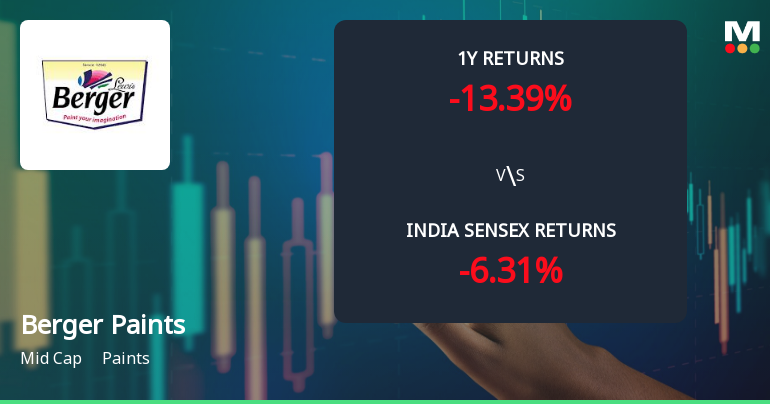
Berger Paints India Ltd Technical Momentum Shifts Amid Mixed Market Signals
Berger Paints India Ltd has experienced a notable shift in its technical momentum, moving from a mildly bearish to a mildly bullish trend despite a recent decline in share price. The stock’s technical indicators present a complex picture, with weekly signals showing optimism contrasting with more cautious monthly trends. Investors are advised to carefully analyse these mixed signals as the mid-cap paint company navigates a challenging market environment.
Read full news article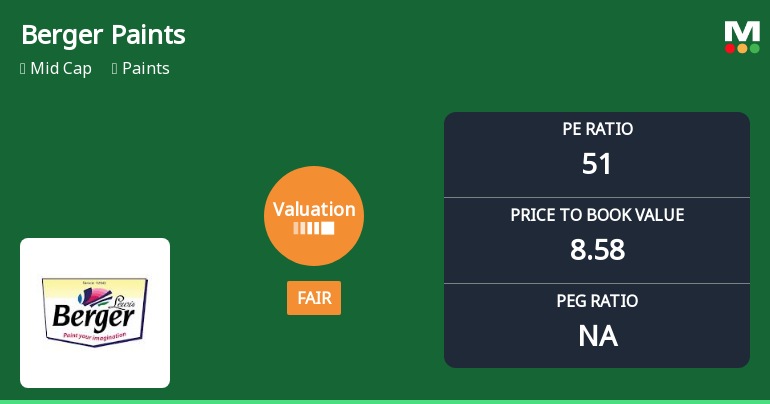
Berger Paints India Ltd Valuation Shifts to Fair Amid Market Pressure
Berger Paints India Ltd has witnessed a notable shift in its valuation parameters, moving from an expensive to a fair valuation grade amid a recent downgrade in its overall market rating. Despite robust return on capital employed (ROCE) and return on equity (ROE) figures, the stock’s price-to-earnings (P/E) and price-to-book value (P/BV) ratios remain elevated compared to historical and peer averages, prompting a reassessment of its price attractiveness.
Read full news article Announcements
Berger Paints (I) Limited - Other General Purpose
21-Nov-2019 | Source : NSEBerger Paints (I) Limited has informed the Exchange regarding Intimation pursuant to Regulation 23(9) of the SEBI (Listing Obligations and Disclosure Requirements) Regulations, 2015 ("Listing Regulations").
Berger Paints (I) Limited - Acquisition
04-Nov-2019 | Source : NSEBerger Paints (I) Limitedulations, 2015 and further to our intimation under Regulation 30 of the SEBI (LODR) Regulations, 2015 dated 15th October, 2019 and our letter dated 18th October, 2019, copies of which are attached for your ready reference, we would like to inform you that the Company has till now acquired 91.94 % of the paid-up equity share capital of STP Limited out of 95.53% to be acquired by the Company. The balance 3.59% of the paid-up equity share capital is intended to be acquired shortly, as per the Share Purchase Agreement entered between the parties.
Berger Paints (I) Limited - Updates
18-Oct-2019 | Source : NSEBerger Paints (I) Limited has informed the Exchange regarding 'Further to the announcement made under Regulation 30 of SEBI (Listing Obligations and Disclosure Requirements) Regulations, 2015 as well as SEBI (Prohibition of Insider Trading) Regulations, 2015 on 15th October, 2019, a copy of which is enclosed for your ready reference, this is to inform you that the Company has today signed a Share Purchase Agreement with the concerned shareholders of STP Limited.'.
Corporate Actions

05 Aug 2026

Berger Paints India Ltd has declared 400% dividend, ex-date: 05 Aug 26

Berger Paints India Ltd has announced 1:2 stock split, ex-date: 08 Jan 15

Berger Paints India Ltd has announced 1:5 bonus issue, ex-date: 22 Sep 23

No Rights history available
Quality key factors
Valuation key factors
Technicals key factors
 Technical Indicator Scale: Bearish, Mildly Bearish, Sideways, Mildly Bullish, Bullish Turned
 Shareholding Snapshot : Mar 2026
Shareholding Compare (%holding)
Promoters
None
Held by 25 Schemes (6.8%)
Held by 156 FIIs (4.68%)
U K Paints (india) Private Limited (64.56%)
Sbi Large & Midcap Fund (4.33%)
6.09%
Quarterly Results Snapshot (Consolidated) - Mar'26 - QoQ

QoQ Growth in quarter ended Mar 2026 is -3.89% vs 5.53% in Dec 2025
QoQ Growth in quarter ended Mar 2026 is 23.46% vs 31.45% in Dec 2025
Half Yearly Results Snapshot (Consolidated) - Sep'25

Growth in half year ended Sep 2025 is 2.77% vs 1.19% in Sep 2024
Growth in half year ended Sep 2025 is -16.41% vs -3.52% in Sep 2024
Nine Monthly Results Snapshot (Consolidated) - Dec'25
YoY Growth in nine months ended Dec 2025 is 1.94% vs 1.87% in Dec 2024
YoY Growth in nine months ended Dec 2025 is -13.75% vs -2.89% in Dec 2024
Annual Results Snapshot (Consolidated) - Mar'26
YoY Growth in year ended Mar 2026 is 2.91% vs 3.09% in Mar 2025
YoY Growth in year ended Mar 2026 is -4.53% vs 1.08% in Mar 2025
About Berger Paints India Ltd

Company Coordinates


