
Compare Beta Drugs Ltd with Similar Stocks
Stock DNA
Pharmaceuticals & Biotechnology
INR 1,795 Cr (Micro Cap)
37.00
34
0.00%
0.09
16.95%
6.11
Total Returns (Price + Dividend) 
Beta Drugs Ltd for the last several years.
Risk Adjusted Returns v/s
Returns Beta

News
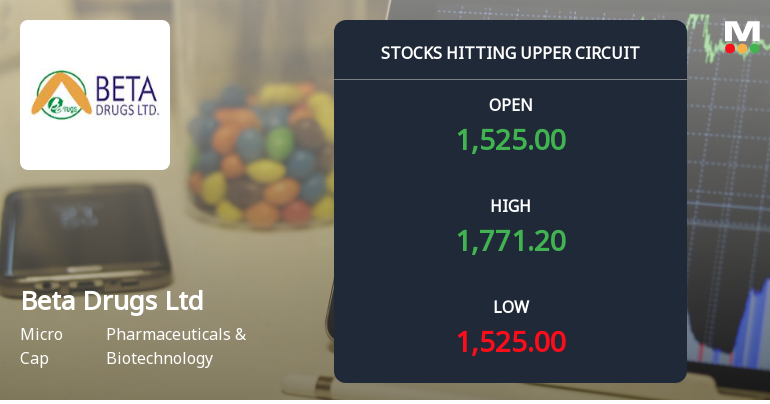
Beta Drugs Ltd Locks at Upper Circuit With 19.4% Gain — Buyers Queue, Sellers Absent
At Rs 1,760, the buying was done — not because demand dried up, but because the exchange wouldn't let the stock go any higher. Beta Drugs Ltd locked at its upper circuit of 19.24% on 12 Jun 2026, with buyers queuing and no sellers willing to part with shares.
Read full news article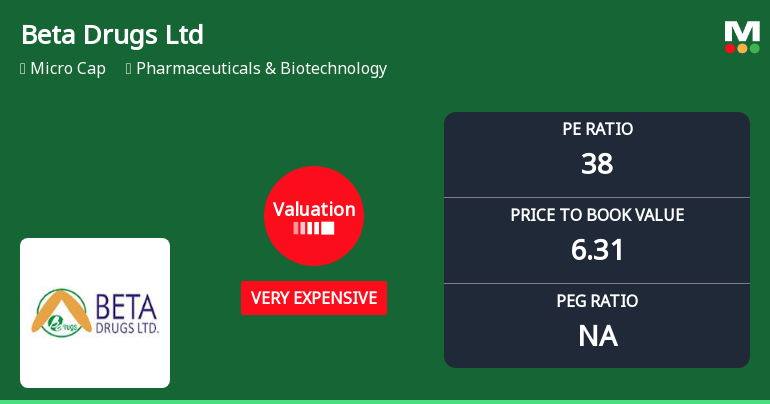
Beta Drugs Ltd Valuation Shifts to Very Expensive Amidst Strong Price Gains
Beta Drugs Ltd, a micro-cap player in the Pharmaceuticals & Biotechnology sector, has seen a marked shift in its valuation parameters, moving from an expensive to a very expensive rating. This change, coupled with a recent 6.49% intraday price surge, invites a closer examination of its price-to-earnings (P/E) and price-to-book value (P/BV) ratios relative to historical trends and peer benchmarks.
Read full news article
Beta Drugs Ltd is Rated Sell
Beta Drugs Ltd is rated Sell by MarketsMOJO. This rating was last updated on 14 May 2026, reflecting a comprehensive assessment of the stock’s outlook. However, all fundamentals, returns, and financial metrics discussed below are current as of 09 June 2026, providing investors with the latest perspective on the company’s position in the market.
Read full news article Announcements
Beta Drugs Limited - Updates
15-Nov-2019 | Source : NSEBeta Drugs Limited has informed the Exchange regarding 'International Plant Approvals'.
Beta Drugs Limited - Reply to Clarification- Financial results
14-Nov-2019 | Source : NSEBeta Drugs Limitedgs Limited for the quarter ended 30-Sep-2019 with respect to Regulation 33 of the SEBI (Listing Obligations and Disclosure Requirements) Regulations, 2015.
Beta Drugs Limited - Clarification - Financial Results
08-Nov-2019 | Source : NSEBeta Drugs Limiteded for the quarter ended 30-Sep-2019 with respect to Regulation 33 of the SEBI (Listing Obligations and Disclosure Requirements) Regulations, 2015.
Corporate Actions

No Upcoming Board Meetings

No Dividend history available

No Splits history available

Beta Drugs Ltd has announced 1:20 bonus issue, ex-date: 26 Mar 25

No Rights history available
Quality key factors
Valuation key factors
Technicals key factors
 Technical Indicator Scale: Bearish, Mildly Bearish, Sideways, Mildly Bullish, Bullish Turned
 Shareholding Snapshot : Mar 2026
Shareholding Compare (%holding)
Promoters
None
Held by 0 Schemes
Held by 4 FIIs (0.9%)
Neeraj Batra (65.96%)
Suryavanshi Commotrade Private Limited (6.74%)
21.81%
Quarterly Results Snapshot (Standalone) - Mar'26 - YoY
Not Applicable: The company has declared_date for only one period
Not Applicable: The company has declared_date for only one period
Half Yearly Results Snapshot (Consolidated) - Sep'25

Growth in half year ended Sep 2025 is 11.83% vs 0.97% in Mar 2025
Growth in half year ended Sep 2025 is 33.04% vs -26.43% in Mar 2025
Nine Monthly Results Snapshot (Consolidated) - Dec'25

YoY Growth in nine months ended Dec 2025 is 6.05% vs 16.59% in Mar 2026
YoY Growth in nine months ended Dec 2025 is -3.14% vs 15.80% in Mar 2026
Annual Results Snapshot (Consolidated) - Mar'26
YoY Growth in year ended Mar 2026 is 6.20% vs 22.54% in Mar 2025
YoY Growth in year ended Mar 2026 is -2.22% vs 16.41% in Mar 2025
About Beta Drugs Ltd

Company Coordinates


