
Compare BF Investment with Similar Stocks
Dashboard
Weak Long Term Fundamental Strength with an average Return on Equity (ROE) of 4.79%
With a growth in Net Sales of 270.33%, the company declared Outstanding results in Mar 26
With ROE of 3.3, it has a Attractive valuation with a 0.2 Price to Book Value
Despite the size of the company, domestic mutual funds hold only 0.02% of the company
Stock DNA
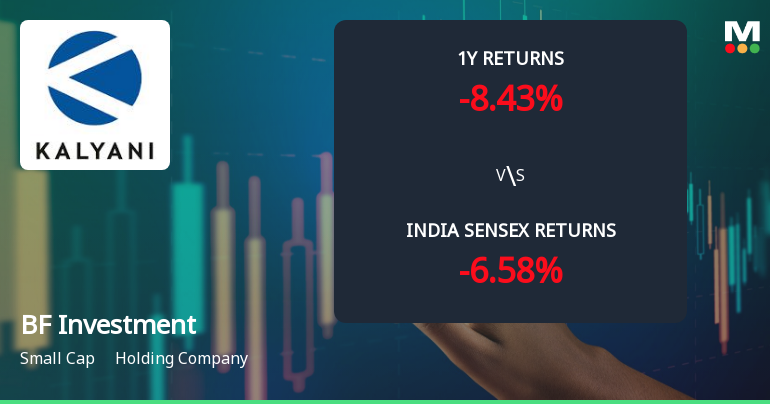
Holding Company
INR 1,675 Cr (Small Cap)
6.00
NA
2.24%
0.00
3.30%
0.20
Total Returns (Price + Dividend) 
Latest dividend: 9.998894783377542 per share ex-dividend date: Jul-03-2026
Risk Adjusted Returns v/s
Returns Beta

News
BF Investment Ltd Technical Momentum Shifts Amid Mixed Market Signals
BF Investment Ltd, a small-cap holding company, has experienced a nuanced shift in its technical momentum, reflecting a complex interplay of bullish and bearish signals across multiple timeframes. Despite a recent downgrade in daily price performance, the stock’s year-to-date returns outpace the Sensex, signalling resilience amid broader market volatility.
Read full news article
BF Investment Ltd is Rated Hold by MarketsMOJO
BF Investment Ltd is rated 'Hold' by MarketsMOJO, with this rating last updated on 23 June 2026. However, the analysis and financial metrics discussed here reflect the stock’s current position as of 05 July 2026, providing investors with an up-to-date view of the company’s fundamentals, valuation, financial trends, and technical outlook.
Read full news article
BF Investment Ltd Technical Momentum Shifts to Bullish Amid Market Recovery
BF Investment Ltd has witnessed a notable shift in its technical momentum, moving from a mildly bullish stance to a more confident bullish trend. This change is underpinned by a combination of positive signals from key technical indicators such as MACD, moving averages, and Bollinger Bands, suggesting renewed investor interest and potential upside in the near term.
Read full news article Announcements
BF Investment Limited - Updates
16-Oct-2019 | Source : NSEBF Investment Limited has informed the Exchange regarding 'Certificate under Regulation 74(5) of the SEBI (Depositories and Participants) Regulations, 2018 up to 30th September, 2019'.
BF Investment Limited - Shareholders meeting
26-Sep-2019 | Source : NSEBF Investment Limited has submitted the Exchange a copy Srutinizers report of Annual General Meeting held on September 25, 2019. Further, the company has informed the Exchange regarding voting results.
Updates
24-Sep-2019 | Source : NSE
| BF Investment Limited has informed the Exchange regarding 'Newspaper Advertisement - Notice of 10th Annual General Meeting (AGM) of the Company'. |
Corporate Actions

No Upcoming Board Meetings

BF Investment Ltd has declared 200% dividend, ex-date: 03 Jul 26

No Splits history available

No Bonus history available

No Rights history available
Quality key factors
Valuation key factors
Technicals key factors
 Technical Indicator Scale: Bearish, Mildly Bearish, Sideways, Mildly Bullish, Bullish Turned
 Shareholding Snapshot : Mar 2026
Shareholding Compare (%holding)
Promoters
None
Held by 6 Schemes (0.0%)
Held by 9 FIIs (0.66%)
Ajinkya Investment And Trading Company (34.1%)
Krutadnya Management And Trading Services Llp (4.16%)
15.11%
Quarterly Results Snapshot (Consolidated) - Mar'26 - QoQ

QoQ Growth in quarter ended Mar 2026 is 270.33% vs -47.75% in Dec 2025

QoQ Growth in quarter ended Mar 2026 is 27.81% vs 123.73% in Dec 2025
Half Yearly Results Snapshot (Consolidated) - Sep'25
Growth in half year ended Sep 2025 is 9.43% vs 28.61% in Sep 2024
Growth in half year ended Sep 2025 is -64.14% vs 74.10% in Sep 2024
Nine Monthly Results Snapshot (Consolidated) - Dec'25
YoY Growth in nine months ended Dec 2025 is 9.36% vs 20.54% in Dec 2024
YoY Growth in nine months ended Dec 2025 is -25.64% vs 22.95% in Dec 2024
Annual Results Snapshot (Consolidated) - Mar'26
YoY Growth in year ended Mar 2026 is 23.05% vs 46.19% in Mar 2025
YoY Growth in year ended Mar 2026 is 26.87% vs -48.75% in Mar 2025
About BF Investment Ltd

Company Coordinates


