
Compare Guru Krupa Gems with Similar Stocks
Dashboard
Weak Long Term Fundamental Strength with a -9.76% CAGR growth in Operating Profits over the last 5 years
- Company's ability to service its debt is weak with a poor EBIT to Interest (avg) ratio of 1.12
- The company has been able to generate a Return on Equity (avg) of 3.72% signifying low profitability per unit of shareholders funds
Negative results in Mar 26
With ROE of 2.3, it has a Very Expensive valuation with a 2.2 Price to Book Value
Stock DNA
Gems, Jewellery And Watches
INR 54 Cr (Micro Cap)
96.00
47
0.00%
0.02
2.30%
2.25
Total Returns (Price + Dividend) 
Guru Krupa Gems for the last several years.
Risk Adjusted Returns v/s
Returns Beta

News

Guru Krupa Gems & Jewellery Ltd is Rated Strong Sell
Guru Krupa Gems & Jewellery Ltd is rated Strong Sell by MarketsMOJO, with this rating last updated on 01 June 2026. However, the analysis and financial metrics discussed here reflect the stock's current position as of 29 June 2026, providing investors with the latest insights into its performance and outlook.
Read full news article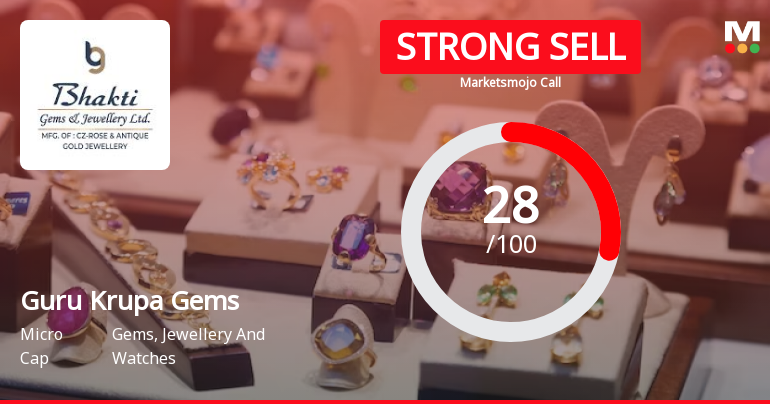
Guru Krupa Gems & Jewellery Ltd is Rated Strong Sell
Guru Krupa Gems & Jewellery Ltd is rated Strong Sell by MarketsMOJO, with this rating last updated on 01 June 2026. However, the analysis and financial metrics discussed here reflect the stock's current position as of 18 June 2026, providing investors with an up-to-date view of the company’s fundamentals, valuation, financial trends, and technical outlook.
Read full news article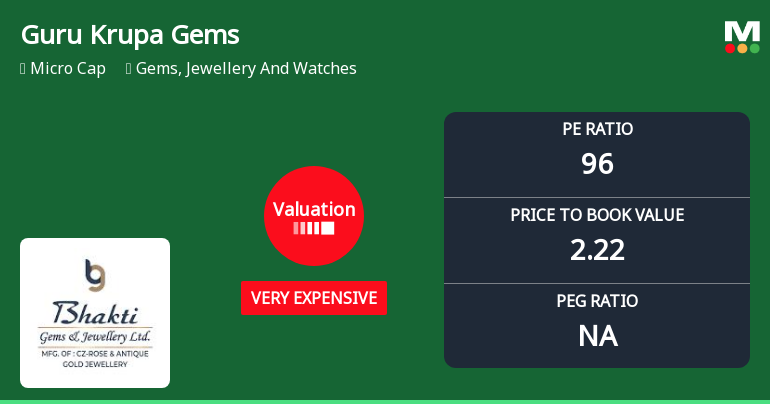
Guru Krupa Gems & Jewellery Ltd Valuation Shifts Signal Overvaluation Amid Sector Peers
Guru Krupa Gems & Jewellery Ltd has seen a marked shift in its valuation parameters, moving from a fair to a very expensive rating, driven primarily by a steep rise in its price-to-earnings ratio. Despite impressive long-term returns, the stock’s current multiples raise questions about its price attractiveness relative to peers and historical benchmarks.
Read full news article Announcements
Outcome Of Board Meeting Under Regulation 30 Of The SEBI (Listing Obligations And Disclosure Requirements) Regulations 2015
16-Jun-2026 | Source : BSEPursuant to Regulation 30 of the SEBI (LODR) we hereby inform that the Board has considered and noted the attached outcome of the Board meeting held today.
Board Meeting Outcome for Outcome Of Board Meeting Under Regulation 30 Of The SEBI (Listing Obligations And Disclosure Requirements) Regulations 2015
16-Jun-2026 | Source : BSEPursuant to Regulation 30 read with Schedule III of the SEBI (Listing Obligations and Disclosure Requirements) Regulations 2015 we hereby inform you that the Board of Directors of the Company at its meeting held on Tuesday 16th June 2026 i.e. today at the Registered Office of the Company situated at FF/02 413/1 Kalp Bhakti House Nr Narayan Society B/h Axis Bank C G Road Ashram Road P.O. Ahmedabad - 380009 Gujarat India which commenced at 04:00 PM and concluded at 06:30 PM inter alia considered and noted the following.
Intimation Of Ln-Principle Approval Received For Issue Of 3200000 Equity Shares Of Rs. 10.00/- Each Issued On A Preferential Basis By GURU KRUPA GEMS AND JEWELLERY LIMITED (The Company)
03-Jun-2026 | Source : BSEPlease find attached In-principle approval received from the stock exchange vide reference letter number LOD/PREF/TT/FIP/291/2026-27
Corporate Actions

No Upcoming Board Meetings

No Dividend history available

No Splits history available

Guru Krupa Gems & Jewellery Ltd has announced 15:100 bonus issue, ex-date: 04 Oct 19

Guru Krupa Gems & Jewellery Ltd has announced 1:2 rights issue, ex-date: 31 May 23
Quality key factors
Valuation key factors
Technicals key factors
 Technical Indicator Scale: Bearish, Mildly Bearish, Sideways, Mildly Bullish, Bullish Turned
 Shareholding Snapshot : Mar 2026
Shareholding Compare (%holding)
Non Institution
None
Held by 0 Schemes
Held by 0 FIIs
Akshay Sevantilal Mehta (8.97%)
Veeram Vendors Private Limited (8.31%)
61.65%
Quarterly Results Snapshot (Standalone) - Mar'26 - YoY

YoY Growth in quarter ended Mar 2026 is -84.66% vs 30.48% in Mar 2025
YoY Growth in quarter ended Mar 2026 is -70.00% vs 42.86% in Mar 2025
Half Yearly Results Snapshot (Standalone) - Sep'25
Growth in half year ended Sep 2025 is -57.91% vs -24.86% in Sep 2024

Growth in half year ended Sep 2025 is -22.22% vs -27.03% in Sep 2024
Nine Monthly Results Snapshot (Standalone) - Dec'25
YoY Growth in nine months ended Dec 2025 is -67.83% vs -0.52% in Dec 2024
YoY Growth in nine months ended Dec 2025 is 26.32% vs -20.83% in Dec 2024
Annual Results Snapshot (Standalone) - Mar'26
YoY Growth in year ended Mar 2026 is -73.81% vs 8.65% in Mar 2025
YoY Growth in year ended Mar 2026 is -16.18% vs -12.82% in Mar 2025
About Guru Krupa Gems & Jewellery Ltd

Company Coordinates


