
Compare Bharat Bijlee with Similar Stocks
Stock DNA
Other Electrical Equipment
INR 3,133 Cr (Small Cap)
26.00
43
1.29%
0.02
5.92%
1.51
Total Returns (Price + Dividend) 
Latest dividend: 35 per share ex-dividend date: Sep-04-2025
Risk Adjusted Returns v/s
Returns Beta

News
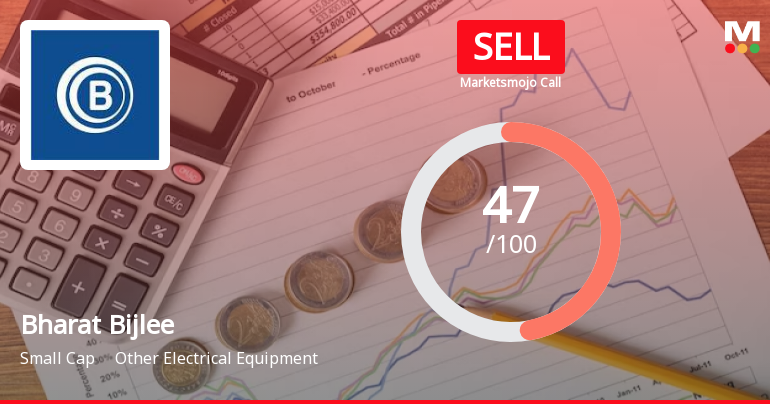
Bharat Bijlee Ltd is Rated Sell
Bharat Bijlee Ltd is rated Sell by MarketsMOJO, with this rating last updated on 01 June 2026. However, the analysis and financial metrics discussed here reflect the stock's current position as of 13 June 2026, providing investors with an up-to-date view of the company's fundamentals, returns, and technical outlook.
Read full news article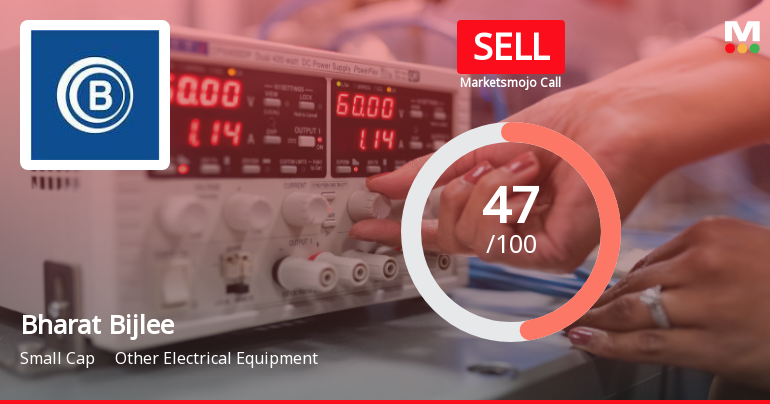
Bharat Bijlee Ltd Downgraded to Sell Amid Valuation and Financial Concerns
Bharat Bijlee Ltd, a small-cap player in the Other Electrical Equipment sector, has seen its investment rating downgraded from Hold to Sell as of 1 June 2026. This change reflects a reassessment across four key parameters: quality, valuation, financial trend, and technicals, with valuation concerns and flat recent financial performance driving the downgrade despite the company’s strong long-term growth record.
Read full news article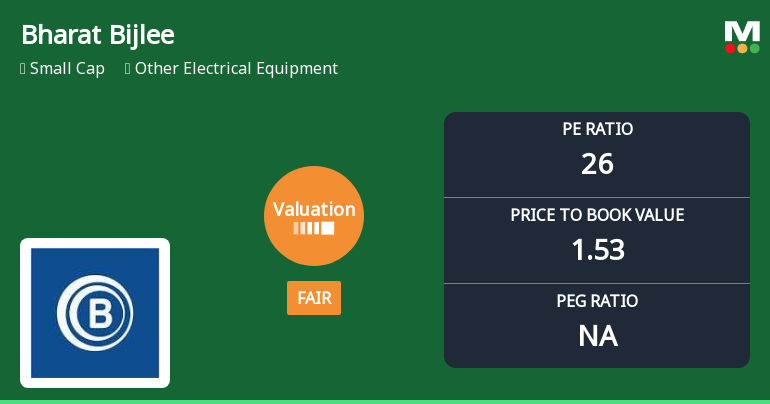
Bharat Bijlee Ltd Valuation Shifts: From Attractive to Fair Amid Sector Comparisons
Bharat Bijlee Ltd, a key player in the Other Electrical Equipment sector, has experienced a notable shift in its valuation parameters, moving from an attractive to a fair rating. This change reflects evolving market perceptions amid rising price-to-earnings and price-to-book ratios, positioning the stock differently against its peers and historical benchmarks.
Read full news article Announcements
Announcement under Regulation 30 (LODR)-Credit Rating
09-Jun-2026 | Source : BSEIntimation of Reaffirmation of Credit Rating and Outlook.
Corporate Action - Revised Record Date Intimation
14-May-2026 | Source : BSERevised Record Date Intimation
Announcement under Regulation 30 (LODR)-Newspaper Publication
14-May-2026 | Source : BSENewspaper Publication - Audited Financial Results
Corporate Actions

No Upcoming Board Meetings

Bharat Bijlee Ltd has declared 700% dividend, ex-date: 15 Jul 26

Bharat Bijlee Ltd has announced 5:10 stock split, ex-date: 24 Apr 24

No Bonus history available

No Rights history available
Quality key factors
Valuation key factors
Technicals key factors
 Technical Indicator Scale: Bearish, Mildly Bearish, Sideways, Mildly Bullish, Bullish Turned
 Shareholding Snapshot : Mar 2026
Shareholding Compare (%holding)
Non Institution
None
Held by 7 Schemes (11.33%)
Held by 63 FIIs (4.1%)
Danmet Chemicals Pvt Limited (8.14%)
General Insurance Corporation Of India (4.35%)
36.97%
Quarterly Results Snapshot (Standalone) - Mar'26 - QoQ

QoQ Growth in quarter ended Mar 2026 is 34.96% vs 20.05% in Dec 2025
QoQ Growth in quarter ended Mar 2026 is 59.24% vs -12.58% in Dec 2025
Half Yearly Results Snapshot (Standalone) - Sep'25
Growth in half year ended Sep 2025 is 22.05% vs -10.73% in Sep 2024
Growth in half year ended Sep 2025 is 31.34% vs -19.73% in Sep 2024
Nine Monthly Results Snapshot (Standalone) - Dec'25
YoY Growth in nine months ended Dec 2025 is 17.47% vs -0.19% in Dec 2024

YoY Growth in nine months ended Dec 2025 is -3.06% vs 0.52% in Dec 2024
Annual Results Snapshot (Standalone) - Mar'26
YoY Growth in year ended Mar 2026 is 19.57% vs 1.56% in Mar 2025
YoY Growth in year ended Mar 2026 is -10.15% vs 1.68% in Mar 2025
About Bharat Bijlee Ltd

Company Coordinates


