
Compare Bharat Gears with Similar Stocks
Dashboard
With a growth in Net Profit of 196.49%, the company declared Very Positive results in Mar 26
- The company has declared positive results for the last 5 consecutive quarters
- PAT(Q) At Rs 5.07 cr has Grown at 196.5%
- PBT LESS OI(Q) At Rs 4.70 cr has Grown at 67.86%
- NET SALES(Q) Highest at Rs 210.29 cr
With ROCE of 7.2, it has a Very Attractive valuation with a 1.3 Enterprise value to Capital Employed
Majority shareholders : Promoters
Market Beating Performance
Stock DNA
Auto Components & Equipments
INR 171 Cr (Micro Cap)
10.00
35
0.00%
0.54
13.54%
1.39
Total Returns (Price + Dividend) 
Latest dividend: 1 per share ex-dividend date: Jul-29-2019
Risk Adjusted Returns v/s
Returns Beta

News

Bharat Gears Ltd Upgraded to Strong Buy on Robust Financials and Bullish Technicals
Bharat Gears Ltd has seen its investment rating upgraded from Buy to Strong Buy as of 5 June 2026, reflecting significant improvements across quality, valuation, financial trends, and technical indicators. The micro-cap auto components company’s recent quarterly performance, coupled with bullish technical signals, has prompted analysts to revise their outlook positively, signalling strong growth potential despite some lingering risks.
Read full news articleAre Bharat Gears Ltd latest results good or bad?
Bharat Gears Ltd has reported its financial results for Q4 FY26, showcasing significant growth in both revenue and net profit. The company achieved a record quarterly revenue of ₹210.29 crores, reflecting a year-on-year growth of 20.26% from ₹174.86 crores in Q4 FY25. This marks a notable recovery from previous periods, indicating a positive trend in sales performance. Net profit for the quarter stood at ₹5.07 crores, which represents a substantial year-on-year increase of 196.49% compared to ₹1.71 crores in Q4 FY25. This recovery in profitability suggests an operational turnaround, although it is important to note that the operating margin, reported at 6.38%, has contracted by 0.82 percentage points from the previous year’s 7.20%. This compression in margins highlights ongoing cost pressures that the company faces, despite the revenue growth. The company's return on equity (ROE) has improved to 10.78%, i...
Read full news article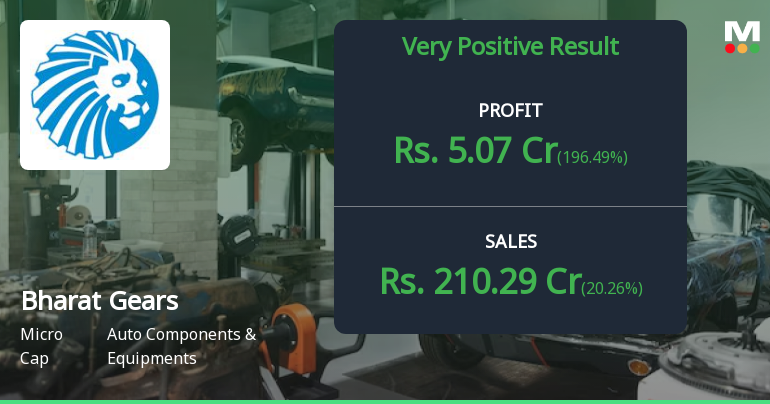
Bharat Gears Q4 FY26: Strong Profit Recovery Masks Margin Pressures
Bharat Gears Ltd., a major global supplier of automotive gears and heat treatment furnaces, reported a net profit of ₹5.07 crores in Q4 FY26, representing a remarkable sequential recovery of 97.28% from ₹2.57 crores in Q3 FY26 and a substantial year-on-year surge of 196.49% from ₹1.71 crores in Q4 FY25. The micro-cap auto component manufacturer, with a market capitalisation of ₹181.00 crores, delivered its highest-ever quarterly revenue of ₹210.29 crores during the period, though margin pressures and debt levels continue to warrant careful monitoring.
Read full news article Announcements
Announcement under Regulation 30 (LODR)-Acquisition
04-Jun-2026 | Source : BSEPursuant to Regulation 30 read with Schedule III of the SEBI (Listing Obligations and Disclosure Requirements) Regulations 2015 (the Regulations) we wish to inform you that Bharat Gears Limited (the Company) has made investment with regard to the requirements under the applicable Electricity Laws for the time being in force upon purchase of Solar Power by the Company for Faridabad and Mumbra Unit of the Company. You are requested to kindly take the same on your records.
Announcement under Regulation 30 (LODR)-Newspaper Publication
01-Jun-2026 | Source : BSEPursuant to the Regulation 30 & 47 of SEBI (Listing Obligations and Disclosure Requirements) Regulations 2015 (the Regulations) please find enclosed herewith copy of the AUdited Financial Results for the qusrter/year ended March 31 2026 published by the Company in the newspapers i.e. Financial Express (English) and Jansatta (Hindi) on May 31 2026. This is to further inform that we have not been able to file this intimation within the time prescribed as per the regulation due to weekly off. You are requested to take the same on your records.
Board Meeting Outcome for Outcome Of Board Meeting 1/26-27
30-May-2026 | Source : BSEPursuant to Regulation 30 of the SEBI (Listing Obligations and Disclosure Requirements) Regulations 2015 (the Regulations) we are enclosing herewith Audited Financial Results of the Company along with Audit Report thereon for the quarter and year ended March 31 2026 approved by the Board of Directors of the Company at its Meeting held on May 30 2026 along with declaration for unmodified opinion pursuant to Regulation 33(3)(d) of the Regulations. The meeting of Board of Directors of the Company commenced at 01:15 P.M. and concluded at 03:30 P.M. You are requested to kindly take the same on records.
Corporate Actions

No Upcoming Board Meetings

Bharat Gears Ltd has declared 10% dividend, ex-date: 29 Jul 19

No Splits history available

Bharat Gears Ltd has announced 1:2 bonus issue, ex-date: 27 Sep 22

Bharat Gears Ltd has announced 1:10 rights issue, ex-date: 28 Oct 21
Quality key factors
Valuation key factors
Technicals key factors
 Technical Indicator Scale: Bearish, Mildly Bearish, Sideways, Mildly Bullish, Bullish Turned
 Shareholding Snapshot : Mar 2026
Shareholding Compare (%holding)
Promoters
None
Held by 1 Schemes (0.0%)
Held by 2 FIIs (1.41%)
Surinder Paul Kanwar (37.0%)
Acadian Emerging Markets Micro-cap Equity Master Fund (1.23%)
36.42%
Quarterly Results Snapshot (Standalone) - Mar'26 - YoY

YoY Growth in quarter ended Mar 2026 is 20.26% vs 2.40% in Mar 2025

YoY Growth in quarter ended Mar 2026 is 196.49% vs 198.28% in Mar 2025
Half Yearly Results Snapshot (Standalone) - Sep'25
Growth in half year ended Sep 2025 is 16.32% vs -5.41% in Sep 2024
Growth in half year ended Sep 2025 is -24.64% vs 572.69% in Sep 2024
Nine Monthly Results Snapshot (Standalone) - Dec'25
YoY Growth in nine months ended Dec 2025 is 21.41% vs -3.98% in Dec 2024
YoY Growth in nine months ended Dec 2025 is 672.97% vs 118.52% in Dec 2024
Annual Results Snapshot (Standalone) - Mar'25
YoY Growth in year ended Mar 2025 is -2.34% vs -13.48% in Mar 2024
YoY Growth in year ended Mar 2025 is 132.75% vs -172.20% in Mar 2024
About Bharat Gears Ltd

Company Coordinates


