
Compare Bharat Rasayan with Similar Stocks
Dashboard
Company has a Debt to Equity ratio (avg) of 0.04 times
Poor long term growth as Operating profit has grown by an annual rate -4.17% of over the last 5 years
Positive results in Mar 26
With ROE of 12.5, it has a Very Attractive valuation with a 1.8 Price to Book Value
Majority shareholders : Promoters
Consistent Underperformance against the benchmark over the last 3 years
Stock DNA
Pesticides & Agrochemicals
INR 2,319 Cr (Small Cap)
15.00
28
0.03%
-0.21
12.52%
1.79
Total Returns (Price + Dividend) 
Latest dividend: 1.5 per share ex-dividend date: Sep-12-2025
Risk Adjusted Returns v/s
Returns Beta

News

Bharat Rasayan Ltd is Rated Hold by MarketsMOJO
Bharat Rasayan Ltd is rated 'Hold' by MarketsMOJO, with this rating last updated on 29 May 2026. However, the analysis and financial metrics discussed here reflect the company’s current position as of 12 June 2026, providing investors with an up-to-date view of its fundamentals, returns, and overall outlook.
Read full news article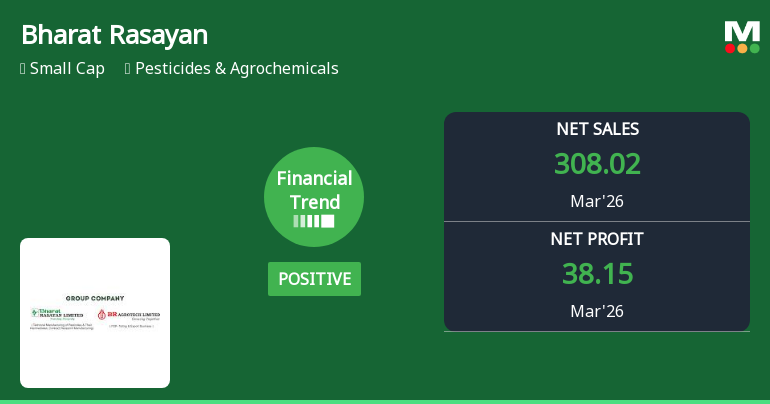
Bharat Rasayan Ltd Reports Mixed Financial Trend Amidst Strong Quarterly Growth
Bharat Rasayan Ltd, a key player in the Pesticides & Agrochemicals sector, reported its quarterly results for March 2026, revealing a shift from a previously positive financial trend to a flat outlook. Despite robust profit growth, the company’s stock performance continues to lag behind broader market indices, raising questions about its near-term prospects.
Read full news article
Bharat Rasayan Ltd Upgraded to Hold by MarketsMOJO on Improved Financials and Valuation
Bharat Rasayan Ltd, a small-cap player in the Pesticides & Agrochemicals sector, has seen its investment rating upgraded from Sell to Hold as of 29 May 2026. This change reflects significant improvements across financial performance, valuation metrics, and technical indicators, signalling a cautious but positive outlook for investors amid a challenging market backdrop.
Read full news article Announcements
Board Meeting Intimation for Results & Closure of Trading Window
09-May-2026 | Source : BSEBharat Rasayan Ltd has informed BSE regarding Board Meeting Intimation for Results & Closure of Trading Window.
Closure of Trading Window
23-Mar-2026 | Source : BSEBharat Rasayan Ltd has informed BSE regarding Closure of Trading Window.
Standalone & Consolidated Financial Results Limited Review Report for December 31 2025
13-Feb-2026 | Source : BSEBharat Rasayan Ltd has informed BSE about :
1. Standalone Financial Results for the period ended December 31 2025
2. Consolidated Financial Results for the period ended December 31 2025
3. Standalone Limited Review for the period ended December 31 2025
4. Consolidated Limited Review for the period ended December 31 2025
Corporate Actions

No Upcoming Board Meetings

Bharat Rasayan Ltd has declared 15% dividend, ex-date: 12 Sep 25

Bharat Rasayan Ltd has announced 5:10 stock split, ex-date: 12 Dec 25

Bharat Rasayan Ltd has announced 1:1 bonus issue, ex-date: 12 Dec 25

No Rights history available
Quality key factors
Valuation key factors
Technicals key factors
 Technical Indicator Scale: Bearish, Mildly Bearish, Sideways, Mildly Bullish, Bullish Turned
 Shareholding Snapshot : Mar 2026
Shareholding Compare (%holding)
Promoters
None
Held by 1 Schemes (1.98%)
Held by 34 FIIs (0.54%)
Sat Narain Gupta (23.83%)
Ritesh Stock Broking Private Limited (4.76%)
10.84%
Quarterly Results Snapshot (Consolidated) - Mar'26 - YoY

YoY Growth in quarter ended Mar 2026 is 0.49% vs -1.00% in Mar 2025
YoY Growth in quarter ended Mar 2026 is 51.81% vs -62.55% in Mar 2025
Half Yearly Results Snapshot (Consolidated) - Sep'25

Growth in half year ended Sep 2025 is 8.74% vs 21.51% in Sep 2024
Growth in half year ended Sep 2025 is -10.26% vs 474.94% in Sep 2024
Nine Monthly Results Snapshot (Consolidated) - Dec'25
YoY Growth in nine months ended Dec 2025 is 7.77% vs 17.89% in Dec 2024
YoY Growth in nine months ended Dec 2025 is -7.10% vs 307.71% in Dec 2024
Annual Results Snapshot (Consolidated) - Mar'26
YoY Growth in year ended Mar 2026 is 5.87% vs 12.29% in Mar 2025
YoY Growth in year ended Mar 2026 is 3.41% vs 47.54% in Mar 2025
About Bharat Rasayan Ltd

Company Coordinates


