
Compare Bharat Seats with Similar Stocks
Dashboard
Healthy long term growth as Net Sales has grown by an annual rate of 28.93% and Operating profit at 48.38%
With a growth in Net Profit of 33.84%, the company declared Very Positive results in Mar 26
With ROCE of 16.6, it has a Fair valuation with a 3.8 Enterprise value to Capital Employed
Despite the size of the company, domestic mutual funds hold only 0.01% of the company
Market Beating performance in long term as well as near term
Stock DNA
Auto Components & Equipments
INR 1,112 Cr (Micro Cap)
26.00
35
0.64%
0.61
20.91%
5.25
Total Returns (Price + Dividend) 
Latest dividend: 1.1 per share ex-dividend date: Jul-02-2025
Risk Adjusted Returns v/s
Returns Beta

News
Bharat Seats Ltd Downgraded to Hold Amid Mixed Technical and Valuation Signals
Bharat Seats Ltd, a micro-cap player in the Auto Components & Equipments sector, has seen its investment rating downgraded from Buy to Hold as of 10 June 2026. This adjustment reflects a nuanced reassessment across four key parameters: quality, valuation, financial trend, and technicals. While the company continues to demonstrate robust long-term growth and solid financial performance, recent shifts in market valuation and technical indicators have prompted a more cautious stance.
Read full news article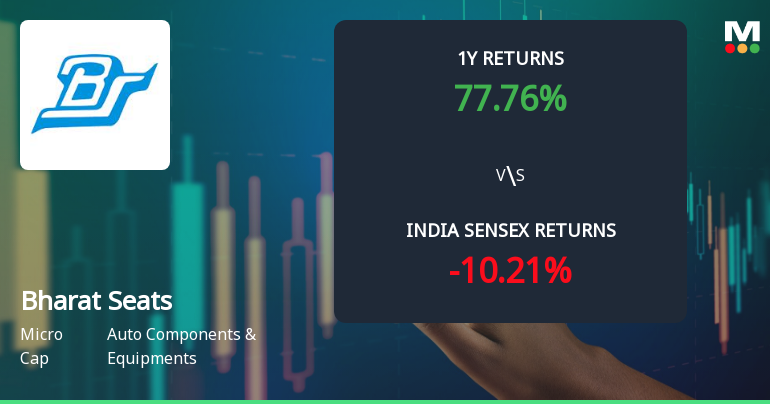
Bharat Seats Ltd Technical Momentum Shifts Amid Mixed Market Signals
Bharat Seats Ltd, a micro-cap player in the Auto Components & Equipments sector, has experienced a notable shift in its technical momentum, moving from a bullish to a mildly bullish stance. Despite a recent 3.37% decline in its share price to ₹180.60, the stock’s longer-term technical indicators remain largely positive, reflecting a complex interplay of market forces and investor sentiment.
Read full news article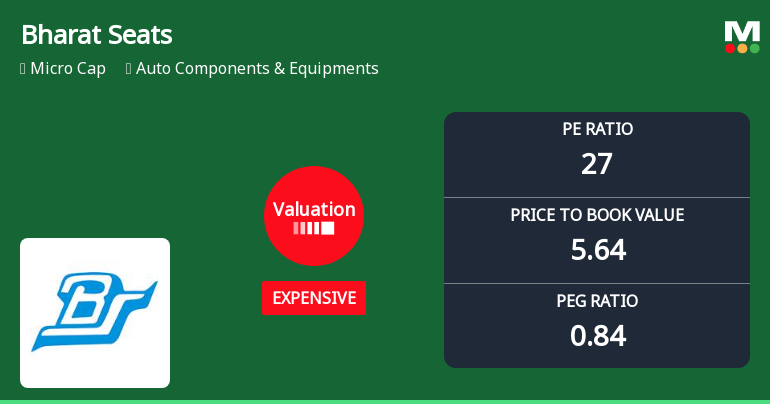
Bharat Seats Ltd Valuation Shifts: Price Attractiveness Under the Lens
Bharat Seats Ltd, a micro-cap player in the Auto Components & Equipments sector, has recently undergone a notable shift in its valuation parameters, moving from a fair to an expensive rating. This change, accompanied by a recent upgrade in its Mojo Grade from Hold to Buy, invites a detailed analysis of its price attractiveness relative to historical trends and peer benchmarks.
Read full news article Announcements
Announcement under Regulation 30 (LODR)-Newspaper Publication
30-May-2026 | Source : BSEAS PER ATTACHMENT
Compliances-Reg.24(A)-Annual Secretarial Compliance
28-May-2026 | Source : BSEas per attachment.
Announcement under Regulation 30 (LODR)-Newspaper Publication
08-May-2026 | Source : BSEAs per attachment.
Corporate Actions

No Upcoming Board Meetings

Bharat Seats Ltd has declared 75% dividend, ex-date: 17 Jul 26

Bharat Seats Ltd has announced 2:10 stock split, ex-date: 28 Jun 07

Bharat Seats Ltd has announced 1:1 bonus issue, ex-date: 20 Dec 24

No Rights history available
Quality key factors
Valuation key factors
Technicals key factors
 Technical Indicator Scale: Bearish, Mildly Bearish, Sideways, Mildly Bullish, Bullish Turned
 Shareholding Snapshot : Mar 2026
Shareholding Compare (%holding)
Promoters
None
Held by 1 Schemes (0.0%)
Held by 5 FIIs (0.15%)
Ndr Auto Components Limited (28.66%)
Sunita Santosh Goenka (1.02%)
20.9%
Quarterly Results Snapshot (Standalone) - Mar'26 - QoQ

QoQ Growth in quarter ended Mar 2026 is 16.96% vs 7.07% in Dec 2025
QoQ Growth in quarter ended Mar 2026 is 33.84% vs 0.00% in Dec 2025
Half Yearly Results Snapshot (Standalone) - Sep'25
Growth in half year ended Sep 2025 is 50.24% vs 9.43% in Sep 2024
Growth in half year ended Sep 2025 is 39.07% vs 19.72% in Sep 2024
Nine Monthly Results Snapshot (Standalone) - Dec'25
YoY Growth in nine months ended Dec 2025 is 53.66% vs 13.59% in Dec 2024
YoY Growth in nine months ended Dec 2025 is 35.99% vs 25.50% in Dec 2024
Annual Results Snapshot (Standalone) - Mar'26
YoY Growth in year ended Mar 2026 is 51.37% vs 20.81% in Mar 2025

YoY Growth in year ended Mar 2026 is 29.14% vs 30.54% in Mar 2025
About Bharat Seats Ltd

Company Coordinates


