
Compare Bharti Hexacom with Similar Stocks
Dashboard
Healthy long term growth as Operating profit has grown by an annual rate 63.68%
The company has declared Positive results for the last 7 consecutive quarters
With ROCE of 21.2, it has a Expensive valuation with a 6.3 Enterprise value to Capital Employed
Majority shareholders : Promoters
Below par performance in long term as well as near term
Stock DNA
Telecom - Services
INR 74,720 Cr (Mid Cap)
42.00
39
0.68%
0.76
24.55%
10.26
Total Returns (Price + Dividend) 
Latest dividend: 10 per share ex-dividend date: Jul-25-2025
Risk Adjusted Returns v/s
Returns Beta

News
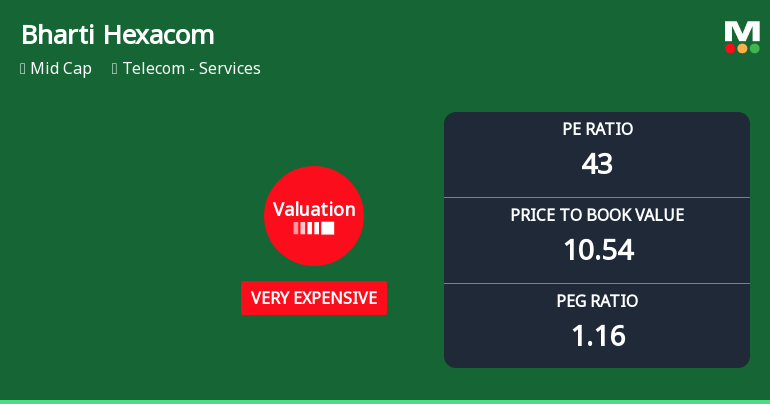
Bharti Hexacom Ltd Valuation Shifts to Very Expensive Amid Mixed Returns
Bharti Hexacom Ltd, a prominent player in the Telecom - Services sector, has witnessed a notable shift in its valuation parameters, moving from an expensive to a very expensive rating. This change reflects evolving market perceptions amid mixed returns and a competitive industry landscape, prompting investors to reassess the stock’s price attractiveness relative to its historical and peer benchmarks.
Read full news article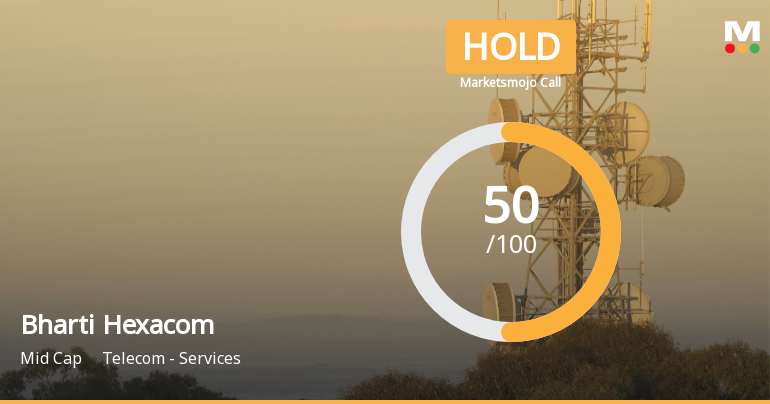
Bharti Hexacom Ltd Upgraded to Hold by MarketsMOJO Amid Mixed Financial and Technical Signals
Bharti Hexacom Ltd, a prominent player in the telecom services sector, has seen its investment rating upgraded from Sell to Hold as of 19 June 2026. This change reflects a nuanced improvement across technical indicators, valuation metrics, financial trends, and overall quality assessments, signalling a cautious but more optimistic outlook for investors amid mixed market performance.
Read full news article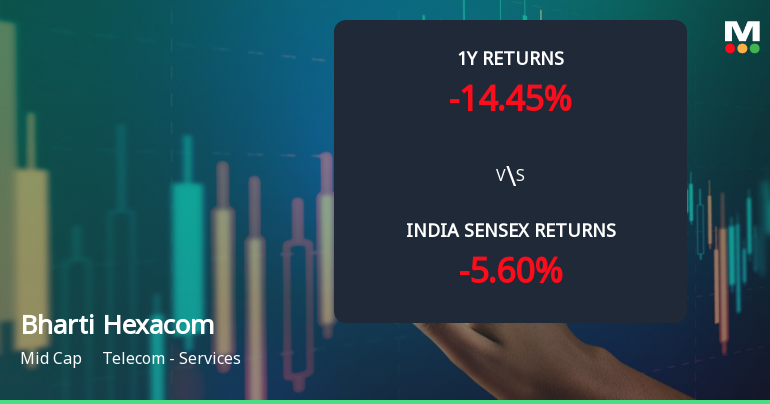
Bharti Hexacom Ltd Technical Momentum Shifts Amid Mixed Market Returns
Bharti Hexacom Ltd, a mid-cap player in the Telecom - Services sector, has witnessed a notable shift in its technical parameters, signalling a mild improvement in price momentum despite lingering bearish undertones. The stock’s recent 3.94% day gain to ₹1,494.15 marks a tentative recovery from its previous close of ₹1,437.55, yet broader technical indicators suggest a complex landscape for investors to navigate.
Read full news article Announcements
Corporate Actions

No Upcoming Board Meetings

Bharti Hexacom Ltd has declared 200% dividend, ex-date: 25 Jul 25

No Splits history available

No Bonus history available

No Rights history available
Quality key factors
Valuation key factors
Technicals key factors
 Technical Indicator Scale: Bearish, Mildly Bearish, Sideways, Mildly Bullish, Bullish Turned
 Shareholding Snapshot : Mar 2026
Shareholding Compare (%holding)
Promoters
None
Held by 34 Schemes (8.42%)
Held by 138 FIIs (3.69%)
Bharti Airtel Limited (70.0%)
Telecommunications Consultants India Limited (15%)
0.56%
Quarterly Results Snapshot (Standalone) - Mar'26 - QoQ

QoQ Growth in quarter ended Mar 2026 is 2.28% vs 1.83% in Dec 2025

QoQ Growth in quarter ended Mar 2026 is -5.70% vs 12.46% in Dec 2025
Half Yearly Results Snapshot (Standalone) - Sep'25
Growth in half year ended Sep 2025 is 14.27% vs 17.19% in Sep 2024
Growth in half year ended Sep 2025 is 6.35% vs 1,006.08% in Sep 2024
Nine Monthly Results Snapshot (Standalone) - Dec'25
YoY Growth in nine months ended Dec 2025 is 10.88% vs 19.88% in Dec 2024
YoY Growth in nine months ended Dec 2025 is 25.49% vs 263.80% in Dec 2024
Annual Results Snapshot (Standalone) - Mar'26
YoY Growth in year ended Mar 2026 is 9.43% vs 20.58% in Mar 2025
YoY Growth in year ended Mar 2026 is 16.04% vs 196.11% in Mar 2025
About Bharti Hexacom Ltd

Company Coordinates


