
Compare Bhartiya Intl. with Similar Stocks
Dashboard
Low ability to service debt as the company has a high Debt to EBITDA ratio of 4.51 times
- Low ability to service debt as the company has a high Debt to EBITDA ratio of 4.51 times
- The company has been able to generate a Return on Equity (avg) of 4.49% signifying low profitability per unit of shareholders funds
Flat results in Mar 26
Despite the size of the company, domestic mutual funds hold only 0% of the company
Stock DNA
Diversified consumer products
INR 1,088 Cr (Micro Cap)
80.00
39
0.00%
0.90
2.76%
2.21
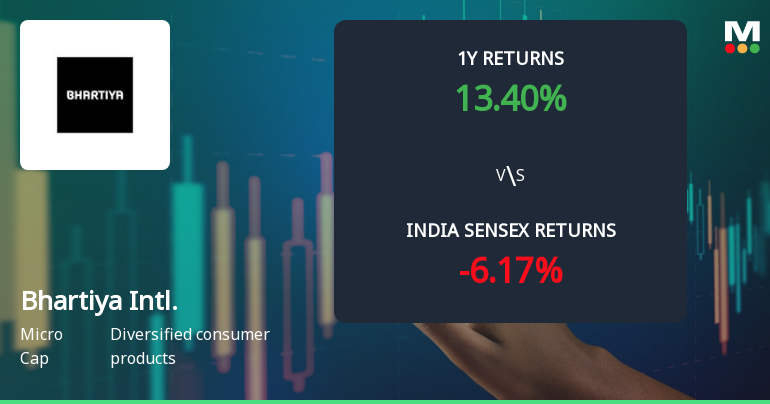
Total Returns (Price + Dividend) 
Latest dividend: 1.2 per share ex-dividend date: Sep-18-2019
Risk Adjusted Returns v/s
Returns Beta

News
Bhartiya International Ltd Sees Technical Momentum Shift Amid Mixed Indicator Signals
Bhartiya International Ltd, a micro-cap player in the diversified consumer products sector, has exhibited a notable shift in its technical momentum, moving from a bearish trend to a sideways stance. This transition is underscored by a complex interplay of technical indicators, including MACD, RSI, Bollinger Bands, and moving averages, signalling a nuanced outlook for investors as the stock price surged 9.25% in a single day.
Read full news article
Bhartiya International Ltd is Rated Sell
Bhartiya International Ltd is rated 'Sell' by MarketsMOJO, with this rating last updated on 01 June 2026. However, the analysis and financial metrics discussed below reflect the stock's current position as of 24 June 2026, providing investors with the most recent insights into the company’s performance and outlook.
Read full news article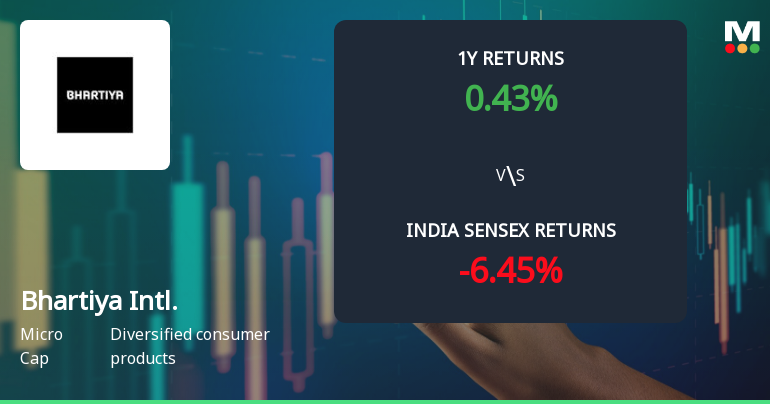
Bhartiya International Ltd Technical Analysis: Momentum Shifts Signal Bearish Outlook
Bhartiya International Ltd, a micro-cap player in the diversified consumer products sector, has experienced a notable shift in its technical momentum, moving from a mildly bearish stance to a more pronounced bearish trend. Despite a modest price decline of 0.18% on 23 Jun 2026, the stock’s technical indicators reveal a complex picture that investors should carefully analyse before making decisions.
Read full news article Announcements
Bhartiya International Limited - Updates
14-Nov-2019 | Source : NSEBhartiya International Limited has informed the Exchange regarding 'SUBMISSION OF STANDALONE AND CONSOLIDATED UNAUDITED FINANCIAL RESULTS FOR THE QUARTER AND HALF YEAR ENDED ON 30TH SEPTEMBER 2019'.
Bhartiya International Limited - Outcome of Board Meeting
13-Nov-2019 | Source : NSEBhartiya International Limited has informed the Exchange regarding Board meeting held on November 13, 2019.
Bhartiya International Limited - Updates
06-Nov-2019 | Source : NSEBhartiya International Limited has informed the Exchange regarding 'We are enclosing herewith certified true copies of the Standalone and Consolidated Unaudited Financial Results as published in Newspapers (Hindu-Tamil and Business Standard- English, Hindi editions) of the Company for the quarter ended on 30th September 2019 as taken on record by the Board of Directors in their meeting held on Wednesday, 13th November 2019.'.
Corporate Actions

No Upcoming Board Meetings

Bhartiya International Ltd has declared 12% dividend, ex-date: 18 Sep 19

No Splits history available

No Bonus history available

No Rights history available
Quality key factors
Valuation key factors
Technicals key factors
 Technical Indicator Scale: Bearish, Mildly Bearish, Sideways, Mildly Bullish, Bullish Turned
 Shareholding Snapshot : Mar 2026
Shareholding Compare (%holding)
Promoters
None
Held by 0 Schemes
Held by 0 FIIs
Bhartiya Global Ventures Private Limited (22.72%)
Chartered Finance & Leasing Limited (5.89%)
16.66%
Quarterly Results Snapshot (Consolidated) - Mar'26 - YoY

YoY Growth in quarter ended Mar 2026 is 29.68% vs 34.22% in Mar 2025
YoY Growth in quarter ended Mar 2026 is -158.85% vs 950.70% in Mar 2025
Half Yearly Results Snapshot (Consolidated) - Sep'25
Growth in half year ended Sep 2025 is 29.36% vs 31.45% in Sep 2024

Growth in half year ended Sep 2025 is 586.73% vs 10.24% in Sep 2024
Nine Monthly Results Snapshot (Consolidated) - Dec'25
YoY Growth in nine months ended Dec 2025 is 32.63% vs 31.82% in Dec 2024
YoY Growth in nine months ended Dec 2025 is 2,862.67% vs 162.50% in Dec 2024
Annual Results Snapshot (Consolidated) - Mar'26
YoY Growth in year ended Mar 2026 is 31.94% vs 32.38% in Mar 2025
YoY Growth in year ended Mar 2026 is -14.18% vs 7,018.18% in Mar 2025
About Bhartiya International Ltd

Company Coordinates


