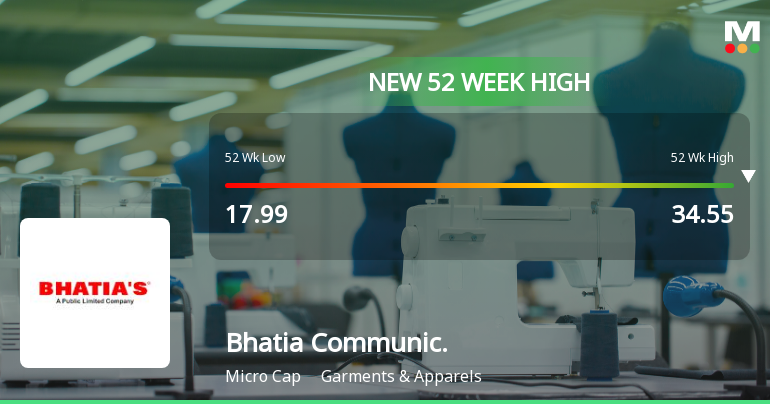
Bhatia Communic.

  • Market Cap: Micro Cap
  • Industry: Garments & Apparels
  • ISIN: INE341Z01025
  • NSEID:
  • BSEID: 540956
INR
34.82
1.86 (5.64%)
BSENSE

Sep 15, 10:45 AM

BSE+NSE Vol: 213010

  • Price Points
  • Score
  • Mojo Parameters
  • Total Return
  • News and Corporate Actions
  • Key factors
  • Shareholding
  • Financials
  • CompanyCV
stock-summaryPrice Point
High/Low

1Day

52 Week

Valuation
Technical
Day's Volume

CASH

2.13 lacs (883.52%) Volume

Shareholding (Jun 2026)

FII

7.54%

Held by 3 FIIs

DII

0.48%

Held by 1 DIIs

Promoter

69.45%

Why is Bhatia Communications & Retail (India) Ltd falling/rising?

06-Sep-2026

As of 05-Sep, Bhatia Communications & Retail (India) Ltd's stock price is rising to Rs 32.02, with a 38.92% increase over the past month, significantly outperforming the Sensex. Despite concerns about declining investor participation, the stock shows strong performance and positive technical indicators.

As of 05-Sep, Bhatia Communications & Retail (India) Ltd's stock price is rising, currently at Rs 32.02, reflecting a change of 0.11 (0.34%) upward. The stock has shown strong performance over various periods, with a notable increase of 38.92% over the past month, significantly outperforming the benchmark Sensex, which declined by 2.44% in the same timeframe. Year-to-date, the stock has risen by 33.14%, while the Sensex has decreased by 10.21%.<BR><BR>Additionally, the stock has been gaining for the last two days, with a total return of 2.69% during this period. It is also trading above its 5-day, 20-day, 50-day, 100-day, and 200-day moving averages, indicating a positive trend in its price movement. Furthermore, it is close to its 52-week high, being only 4.8% away from Rs 33.6.<BR><BR>However, there are some concerns regarding falling investor participation, as the delivery volume has decreased by 12.08% compared to the 5-day average. Despite this, the stock remains liquid enough for trading, which may support its price stability. Overall, the combination of strong recent performance and positive technical indicators contributes to the rising stock price of Bhatia Communications & Retail (India) Ltd.

View full answer

Who are in the management team of Bhatia Communic.?

01-Sep-2026

The management team of Bhatia Communic. includes Sanjeev Bhatia (Chairman/Executive Director), Nikhil Bhatia (Whole-Time Director/Executive Director), Kamleshkumari Harbanslal Bhatia (Non-Executive Director), and independent directors Rachit Narang, Rashmi Arora, and Arpit Jain. They are responsible for the company's strategic direction and governance.

The management team of Bhatia Communic. includes the following individuals:<BR><BR>1. **Sanjeev Bhatia** - Chairman / Executive Director<BR>2. **Nikhil Bhatia** - Whole-Time Director & Executive Director<BR>3. **Kamleshkumari Harbanslal Bhatia** - Non-Executive Director<BR>4. **Rachit Narang** - Independent Non-Executive Director<BR>5. **Rashmi Arora** - Independent Non-Executive Director<BR>6. **Arpit Jain** - Independent Non-Executive Director<BR><BR>This team plays a crucial role in guiding the company's strategic direction and governance.

View full answer

What does Bhatia Communic. do?

01-Sep-2026

Bhatia Communications & Retail (India) Ltd is a Micro Cap company in the Garments & Apparels industry, incorporated in 2008 and converted to a Public Limited Company in 2018, with recent quarterly net sales of 190 Cr and net profit of 7 Cr as of June 2026. Key metrics include a P/E of 22.00, a market cap of INR 441 Cr, and a debt-equity ratio of 0.01.

Overview:<BR>Bhatia Communications & Retail (India) Ltd operates in the Garments & Apparels industry and is classified as a Micro Cap company.<BR><BR>History:<BR>The company was incorporated in 2008 as a Private Limited Company and later converted to a Public Limited Company in 2018. The most recent quarterly results reported net sales and net profit for June 2026.<BR><BR>Financial Snapshot:<BR>Net Sales: 190 Cr (Quarterly Results - Jun 2026) <BR>Net Profit: 7 Cr (Quarterly Results - Jun 2026) <BR>Market Cap: INR 441 Cr (Micro Cap)<BR><BR>Key Metrics:<BR>P/E: 22.00 <BR>Industry P/E: 21 <BR>Dividend Yield: 0.12% <BR>Debt-Equity: 0.01 <BR>Return on Equity: 15.09% <BR>Price to Book: 3.33 <BR><BR>Contact Details:<BR>Address: 132 DrAmbedkar Shopping Centre, Ring Road Surat Gujarat : 395002 <BR>Tel: 91-261-2349892 <BR>Email: info@bhatiamobile.com <BR>Website: http://www.bhatiamobile.com

View full answer

Who are the peers of the Bhatia Communic.?

01-Sep-2026

Bhatia Communic.'s peers include Credo Brands, Vishal Fabrics, Atvo Enterprises, AB Cotspin, Donear Inds., Nandan Denim, Manomay Tex Indi, Thomas Scott, and Suditi Industrie. Bhatia Communic. has average management risk, good growth, and a 1-year return of 11.96%.

Peers: The peers of Bhatia Communic. are Credo Brands, Vishal Fabrics, Atvo Enterprises, AB Cotspin, Donear Inds., Nandan Denim, Manomay Tex Indi, Thomas Scott, and Suditi Industrie.<BR><BR>Quality Snapshot: Excellent management risk is observed at Thomas Scott, while Average management risk is found at Credo Brands, Vishal Fabrics, Donear Inds., Bhatia Communic., and Manomay Tex Indi. Below Average management risk is present at Atvo Enterprises, AB Cotspin, Nandan Denim, Suditi Industrie. Growth is Excellent at Thomas Scott, Good at Bhatia Communic. and Donear Inds., Average at AB Cotspin, while Below Average growth is seen at Credo Brands, Vishal Fabrics, Atvo Enterprises, Nandan Denim, Manomay Tex Indi, and Suditi Industrie. Capital Structure is Good at Credo Brands, Bhatia Communic., and Thomas Scott, Average at Vishal Fabrics, while Below Average is noted for Atvo Enterprises, AB Cotspin, Donear Inds., Nandan Denim, Manomay Tex Indi, and Suditi Industrie.<BR><BR>Return Snapshot: Atvo Enterprises has the highest 1-year return at 152.47%, while Vishal Fabrics has the lowest at -43.14%. Bhatia Communic.'s 1-year return is 11.96%, which is significantly higher than Vishal Fabrics but lower than Atvo Enterprises. Additionally, the six-month returns are negative for Credo Brands, Donear Inds., Nandan Denim, Thomas Scott, and Suditi Industrie.

View full answer

How big is Bhatia Communic.?

01-Sep-2026

As of 31st August, Bhatia Communications & Retail (India) Ltd has a market capitalization of 441.00 Cr, with recent Net Sales of 669.88 Cr and a Net Profit of 20.01 Cr.

As of 31st August, Bhatia Communications & Retail (India) Ltd has a market capitalization of 441.00 Cr, categorizing it as a Micro Cap company.<BR><BR>In the latest four quarters, the company reported Net Sales of 669.88 Cr and a Net Profit of 20.01 Cr.<BR><BR>For the reporting period of March 2026, the Shareholder's Funds amounted to 132.59 Cr, while Total Assets were valued at 198.25 Cr.

View full answer

Should I buy, sell or hold Bhatia Communications & Retail (India) Ltd?

18-Aug-2026

When is the next results date for Bhatia Communications & Retail (India) Ltd?

07-Aug-2026

The next results date for Bhatia Communications & Retail (India) Ltd is 14 August 2026.

The next results date for Bhatia Communications & Retail (India) Ltd is scheduled for 14 August 2026.

View full answer

Are Bhatia Communications & Retail (India) Ltd latest results good or bad?

26-May-2026

Bhatia Communications & Retail (India) Ltd's latest results show strong year-on-year growth with a 63.91% increase in net sales and a 55.30% rise in net profit, but sequential declines in revenue and profit, along with reduced operating margins, indicate potential operational challenges and warrant caution.

Bhatia Communications & Retail (India) Ltd's latest results present a mixed picture. On one hand, the company achieved impressive year-on-year growth, with net sales increasing by 63.91% to ₹170.09 crores in Q4 FY26 compared to the same quarter last year. Additionally, net profit rose by 55.30% year-on-year to ₹4.55 crores. These figures indicate strong market penetration and demand for their products.<BR><BR>However, there are concerning signs when looking at the sequential performance. The company experienced a 3.06% decline in revenue from the previous quarter, and net profit fell by 7.33%. This suggests that while the company is growing compared to last year, it may be facing operational challenges or demand volatility in the short term.<BR><BR>Furthermore, the operating margin has contracted to 3.53%, down from 4.19% in the previous quarter, indicating that the company is struggling to maintain profitability despite increased sales. The overall financial performance reflects a situation where growth is not translating into improved margins, raising concerns about sustainability.<BR><BR>In summary, while Bhatia Communications has demonstrated strong year-on-year growth, the sequential declines in revenue and profit, along with margin pressures, suggest that the latest results are not entirely positive and warrant caution moving forward.

View full answer

Is Bhatia Communic. overvalued or undervalued?

03-Dec-2025

As of December 2, 2025, Bhatia Communications is considered undervalued with an attractive valuation grade, a PE ratio of 25.24, and a strong ROCE of 14.98%, despite a year-to-date stock decline of 8.53%, suggesting it may be a buying opportunity compared to peers like Elitecon International and PTC India.

As of 2 December 2025, Bhatia Communications has moved from a fair to an attractive valuation grade, indicating a shift in its perceived value. The company is currently considered undervalued, with a PE ratio of 25.24, an EV to EBITDA of 18.12, and a ROCE of 14.98%. In comparison to its peers, Bhatia's valuation metrics stand out; for instance, Elitecon International is categorized as very expensive with a PE of 206.74, while PTC India, deemed very attractive, has a significantly lower PE of 7.2.<BR><BR>Despite recent stock performance showing a decline of 8.53% year-to-date compared to the Sensex's gain of 8.96%, the attractive valuation suggests that Bhatia Communications may present a buying opportunity. The company's dividend yield is low at 0.15%, and while its PEG ratio is relatively high at 6.34, the overall financial ratios indicate that it is positioned well within its industry.

View full answer

How has been the historical performance of Bhatia Communic.?

26-Nov-2025

Bhatia Communic. has shown significant growth in net sales and profitability, with net sales increasing from 168.03 Cr in Mar'20 to 442.72 Cr in Mar'25, and operating profit improving from a loss of -9.06 Cr to a profit of 21.86 Cr during the same period. Overall, the company's financial performance has demonstrated a positive trajectory over the years.

Answer:<BR>The historical performance of Bhatia Communic. shows a significant upward trend in net sales and profitability over the years.<BR><BR>Breakdown:<BR>Bhatia Communic. has demonstrated a consistent increase in net sales, rising from 168.03 Cr in Mar'20 to 442.72 Cr in Mar'25. The total operating income also reflects this growth, reaching 442.72 Cr in Mar'25 compared to 180.76 Cr in Mar'19. The company's total expenditure has increased from 172.24 Cr in Mar'19 to 422.83 Cr in Mar'25, yet the operating profit (PBDIT) has improved significantly, moving from a loss of -9.06 Cr in Mar'20 to a profit of 21.86 Cr in Mar'25. Profit before tax has also shown a positive trend, increasing from 7.12 Cr in Mar'19 to 18.31 Cr in Mar'25, with profit after tax following suit, climbing from 5.01 Cr in Mar'19 to 13.82 Cr in Mar'25. The company's total assets have grown from 65.07 Cr in Mar'20 to 130.54 Cr in Mar'25, while total liabilities have also increased from 65.07 Cr to 130.54 Cr during the same period. Cash flow from operating activities has improved, reaching 5.00 Cr in Mar'25, although the net cash outflow was -8.00 Cr in the same year. Overall, Bhatia Communic. has shown a positive trajectory in its financial performance over the years.

View full answer

Has Bhatia Communic. declared dividend?

14-Aug-2025

Bhatia Communications & Retail (India) Ltd has declared a 1% dividend, amounting to ₹0.01 per share, with an ex-date of August 22, 2025. The company has shown strong total returns over the past five years, with a total return of 295.41%.

Bhatia Communications & Retail (India) Ltd has declared a 1% dividend.<BR><BR>Dividend Details:<BR>- Percentage announced: 1%<BR>- Amount per share: 0.01<BR>- Ex-date: 22 Aug 25<BR><BR>Dividend Yield: 0.21%.<BR><BR>Total Returns by Period:<BR>In the last 3 months, the price return was 0.75%, the dividend return was 0.08%, resulting in a total return of 0.83%.<BR><BR>Over the past 6 months, the price return was 0.92%, the dividend return was 0.13%, leading to a total return of 1.05%.<BR><BR>In the 1-year period, the price return was 11.17%, the dividend return was 0.27%, culminating in a total return of 11.44%.<BR><BR>For the 2-year period, the price return was 36.59%, the dividend return was 0.33%, resulting in a total return of 36.92%.<BR><BR>In the 3-year period, the price return was -21.94%, the dividend return was 0.19%, leading to a total return of -21.75%.<BR><BR>Over the last 4 years, the price return was 142.01%, the dividend return was 5.41%, culminating in a total return of 147.42%.<BR><BR>In the 5-year period, the price return was 227.62%, the dividend return was 67.79%, resulting in a total return of 295.41%.<BR><BR>Overall, Bhatia Communications & Retail (India) Ltd has declared a modest dividend while showing significant total returns over longer periods, particularly in the 5-year span, indicating strong performance despite some fluctuations in shorter timeframes.

View full answer

What is the technical trend for Bhatia Communic.?

09-Jun-2025

As of May 27, 2025, Bhatia Communic. shows a bearish technical trend, indicated by bearish weekly MACD and moving averages, with mixed signals from Bollinger Bands and KST, resulting in an overall moderate bearish stance.

As of 27 May 2025, the technical trend for Bhatia Communic. has changed from mildly bearish to bearish. The weekly MACD is bearish, and the daily moving averages also indicate a bearish stance. The Bollinger Bands on both weekly and monthly time frames are mildly bearish, while the KST shows a mildly bullish signal on the weekly but is mildly bearish on the monthly. There are no signals from the RSI on either time frame, and Dow Theory indicates no trend in both weekly and monthly perspectives. Overall, the current technical stance is bearish with moderate strength, primarily driven by the bearish moving averages and MACD.

View full answer

Who are the top shareholders of the Bhatia Communic.?

06-Jun-2025

The top shareholder of Bhatia Communic. is Nikhil Kumar Bhatia, who holds 36.34% of the shares. Individual investors own 20.42%, while a foreign institutional investor holds 0.08%, and there are no mutual funds involved.

The top shareholders of Bhatia Communic. primarily include the promoters, with Nikhil Kumar Bhatia holding the highest stake at 36.34%. There are no pledged promoter holdings, and individual investors collectively hold 20.42% of the shares. Additionally, there is one foreign institutional investor (FII) that holds 0.08% of the shares. There are no mutual funds currently holding shares in the company.

View full answer

What is the bonus history of the Bhatia Communic.?

06-Jun-2025

Bhatia Communications & Retail (India) Ltd announced a 1:1 bonus issue on October 8, 2018, with a record date of October 9, 2018, allowing shareholders to receive one additional share for each share held.

Bhatia Communications & Retail (India) Ltd has a bonus history that includes a 1:1 bonus issue announced on October 8, 2018. The record date for this bonus was October 9, 2018. This means that shareholders received one additional share for every share they held as of the record date.

View full answer
iScoreScore
Click here to find our call on this stock
Strong Sell
Sell
Hold
Buy
Strong Buy

Dashboard

1

Strong ability to service debt as the company has a low Debt to EBITDA ratio of 0.41 times

 
2

Healthy long term growth as Net Sales has grown by an annual rate of 27.76% and Operating profit at 32.92%

 
3

With a growth in Net Profit of 90.5%, the company declared Very Positive results in Jun 26

4

With ROE of 15.1, it has a Attractive valuation with a 3.5 Price to Book Value

5

Increasing Participation by Institutional Investors

stock-summaryMojo Parameters

Mojo Parameters

Loading Valuation Snapshot...

Stock DNA

stock-summary
Industry

Garments & Apparels

stock-summary
Market cap

INR 490 Cr (Micro Cap)

stock-summary
P/E

23.00

stock-summary
Industry P/E

22

stock-summary
Dividend Yield

0.12%

stock-summary
Debt Equity

0.01

stock-summary
Return on Equity

15.09%

stock-summary
Price to Book

3.50

Revenue and Profits:
Net Sales:
190 Cr
(Quarterly Results - Jun 2026)
Net Profit:
7 Cr
stock-summaryTotal Returns
Total Returns (Price + Dividend) stock-summary
Dividend Yield (0.12%)
TimePeriod
Price Return
Dividend Return
Total Return
3 Months
33.21%
0.08%
33.29%
6 Months
60.53%
0.09%
60.62%
1 Year
27.73%
0.15%
27.88%
2 Years
12.4%
0.23%
12.63%
3 Years
88.73%
0.44%
89.17%
4 Years
-9.68%
0.22%
-9.46%
5 Years
141.47%
0.87%
142.34%

Latest dividend: 0.009969594594594596 per share ex-dividend date: Aug-21-2026

Risk Adjusted Returns v/s stock-summary
Returns Beta
Icon
Beta has not been calculated since enough price history is not available
stock-summaryNews & Corporate Actions

Announcements stock-summary

Announcement under Regulation 30 (LODR)-Investor Presentation

20-Aug-2026 | Source : BSE

Please find enclosed herewith Investor Presentation for the quarter ended June 30 2026.

Announcement under Regulation 30 (LODR)-Newspaper Publication

15-Aug-2026 | Source : BSE

Please find enclosed herewith extract of newspaper advertisement for unaudited financial results for the quarter ended on June 302026.

Board Meeting Outcome for Outcome Of Board Meeting Of The Company Held On Friday August 14 2026 And Unaudited Financial Results For The Quarter Ended On June 30 2026.

14-Aug-2026 | Source : BSE

Pursuant to the Regulation 30 of SEBI (Listing Obligations & Disclosure Requirements) Regulations 2015 we wish to inform you that the Board of Directors at their meeting held on Friday August 14 2026 at 11:00 AM at the registered office of the company at Shop No. 307 to 311 First Floor Bhatia Complex Near Sosyo Circle Bamroli Road Bamroli Surat Chorasi Gujarat India 394210 inter-alia transacted following major business:

Corporate Actions stock-summary

stock-summary
BOARD MEETING

No Upcoming Board Meetings

stock-summary
DIVIDEND

Bhatia Communications & Retail (India) Ltd has declared 1% dividend, ex-date: 21 Aug 26

stock-summary
SPLITS

Bhatia Communications & Retail (India) Ltd has announced 1:10 stock split, ex-date: 15 Feb 22

stock-summary
BONUS

Bhatia Communications & Retail (India) Ltd has announced 1:1 bonus issue, ex-date: 08 Oct 18

stock-summary
RIGHTS

No Rights history available

stock-summaryKey Factors

Quality key factors stock-summary

Factor
Value
Sales Growth (5y)
27.76%
EBIT Growth (5y)
32.92%
EBIT to Interest (avg)
2.89
Debt to EBITDA (avg)
Negative Net Debt
Net Debt to Equity (avg)
0.01
Sales to Capital Employed (avg)
4.17
Tax Ratio
25.93%
Dividend Payout Ratio
3.62%
Pledged Shares
0
Institutional Holding
8.02%
ROCE (avg)
0.00%
ROE (avg)
14.89%

Valuation key factors

Factor
Value
P/E Ratio
23
Industry P/E
22
Price to Book Value
3.50
EV to EBIT
18.02
EV to EBITDA
16.01
EV to Capital Employed
3.47
EV to Sales
0.70
PEG Ratio
0.79
Dividend Yield
0.12%
ROCE (Latest)
16.16%
ROE (Latest)
15.09%

Technicals key factors

Indicator
Weekly
Monthly
MACD
Bullish
Bullish
RSI
No Signal
No Signal
Bollinger Bands
Bullish
Bullish
Moving Averages
Bullish (Daily)
KST
Bullish
Bullish
Dow Theory
Mildly Bullish
Mildly Bullish
stock-summary Technical Indicator Scale: Bearish, Mildly Bearish, Sideways, Mildly Bullish, Bullish  Turned 
stock-summaryShareholding
Shareholding Snapshot : Jun 2026stock-summary
Shareholding Compare (%holding) stock-summary
Majority shareholders

Promoters

Pledged Promoter Holdings

None

Mutual Funds

Held by 0 Schemes

FIIs

Held by 3 FIIs (7.54%)

Promoter with highest holding

Nikhil Kumar Bhatia (34.94%)

Highest Public shareholder

Forbes Emf (3.55%)

Individual Investors Holdings

18.0%

stock-summaryFinancial
[
  {
    "link": "quarterly",
    "btn_text": "All Quarterly Results",
    "header": "Quarterly Results Snapshot (Standalone) - Jun'26 - YoY",
    "rhs": [
      {
        "prefix": "Net Sales ",
        "suffix": "YoY Growth in quarter ended Jun 2026 is 70.34% vs 6.41% in Jun 2025",
        "dir": 1
      },
      {
        "prefix": "Standalone Net Profit ",
        "suffix": "YoY Growth in quarter ended Jun 2026 is 90.50% vs -1.92% in Jun 2025",
        "dir": 1
      }
    ],
    "table": {
      "header": [
        "Jun'26",
        "Jun'25",
        "Change(%)"
      ],
      "body": [
        {
          "field": "Net Sales",
          "val1": "190.00",
          "val2": "111.54",
          "chgp": "70.34%",
          "chgp_class": "positive"
        },
        {
          "field": "Operating Profit (PBDIT) excl Other Income",
          "val1": "10.14",
          "val2": "5.61",
          "chgp": "80.75%",
          "chgp_class": "positive"
        },
        {
          "field": "Interest",
          "val1": "0.51",
          "val2": "0.64",
          "chgp": "-20.31%",
          "chgp_class": "positive"
        },
        {
          "field": "Exceptional Items",
          "val1": "0.00",
          "val2": "0.00",
          "chgp": "",
          "chgp_class": "neutral"
        },
        {
          "field": "Standalone Net Profit",
          "val1": "6.82",
          "val2": "3.58",
          "chgp": "90.50%",
          "chgp_class": "positive"
        },
        {
          "field": "Operating Profit Margin (Excl OI)",
          "val1": "5.34%",
          "val2": "5.03%",
          "chgp": "0.31%",
          "chgp_class": "positive"
        }
      ]
    }
  },
  {
    "link": "half-yearly",
    "btn_text": "All Half Yearly Results",
    "header": "Half Yearly Results Snapshot (Standalone) - Sep'25",
    "rhs": [
      {
        "prefix": "Net Sales ",
        "suffix": " Growth in half year ended Sep 2025 is 15.90% vs 10.82% in Sep 2024",
        "dir": 1
      },
      {
        "prefix": "Standalone Net Profit ",
        "suffix": " Growth in half year ended Sep 2025 is 0.14% vs 20.66% in Sep 2024",
        "dir": -1
      }
    ],
    "table": {
      "header": [
        "Sep'25",
        "Sep'24",
        "Change(%)"
      ],
      "body": [
        {
          "field": "Net Sales",
          "val1": "245.88",
          "val2": "212.14",
          "chgp": "15.90%",
          "chgp_class": "positive"
        },
        {
          "field": "Operating Profit (PBDIT) excl Other Income",
          "val1": "11.21",
          "val2": "10.62",
          "chgp": "5.56%",
          "chgp_class": "positive"
        },
        {
          "field": "Interest",
          "val1": "1.49",
          "val2": "0.84",
          "chgp": "77.38%",
          "chgp_class": "negative"
        },
        {
          "field": "Exceptional Items",
          "val1": "0.00",
          "val2": "0.00",
          "chgp": "",
          "chgp_class": "neutral"
        },
        {
          "field": "Standalone Net Profit",
          "val1": "7.31",
          "val2": "7.30",
          "chgp": "0.14%",
          "chgp_class": "positive"
        },
        {
          "field": "Operating Profit Margin (Excl OI)",
          "val1": "4.56%",
          "val2": "5.01%",
          "chgp": "-0.45%",
          "chgp_class": "negative"
        }
      ]
    }
  },
  {
    "link": "nine-monthly",
    "btn_text": "All Nine Monthly Results",
    "header": "Nine Monthly Results Snapshot (Standalone) - Dec'25",
    "rhs": [
      {
        "prefix": "Net Sales ",
        "suffix": "YoY Growth in nine months ended Dec 2025 is 24.30% vs 9.97% in Dec 2024",
        "dir": 1
      },
      {
        "prefix": "Standalone Net Profit ",
        "suffix": "YoY Growth in nine months ended Dec 2025 is 12.32% vs 27.40% in Dec 2024",
        "dir": -1
      }
    ],
    "table": {
      "header": [
        "Dec'25",
        "Dec'24",
        "Change(%)"
      ],
      "body": [
        {
          "field": "Net Sales",
          "val1": "421.33",
          "val2": "338.95",
          "chgp": "24.30%",
          "chgp_class": "positive"
        },
        {
          "field": "Operating Profit (PBDIT) excl Other Income",
          "val1": "18.56",
          "val2": "15.97",
          "chgp": "16.22%",
          "chgp_class": "positive"
        },
        {
          "field": "Interest",
          "val1": "2.24",
          "val2": "1.52",
          "chgp": "47.37%",
          "chgp_class": "negative"
        },
        {
          "field": "Exceptional Items",
          "val1": "0.00",
          "val2": "0.00",
          "chgp": "",
          "chgp_class": "neutral"
        },
        {
          "field": "Standalone Net Profit",
          "val1": "12.22",
          "val2": "10.88",
          "chgp": "12.32%",
          "chgp_class": "positive"
        },
        {
          "field": "Operating Profit Margin (Excl OI)",
          "val1": "4.41%",
          "val2": "4.71%",
          "chgp": "-0.30%",
          "chgp_class": "negative"
        }
      ]
    }
  },
  {
    "link": "annual",
    "btn_text": "All Annual Results",
    "header": "Annual Results Snapshot (Standalone) - Mar'26",
    "rhs": [
      {
        "prefix": "Net Sales ",
        "suffix": "YoY Growth in year ended Mar 2026 is 33.59% vs 6.99% in Mar 2025",
        "dir": 1
      },
      {
        "prefix": "Standalone Net Profit ",
        "suffix": "YoY Growth in year ended Mar 2026 is 21.27% vs 19.97% in Mar 2025",
        "dir": 1
      }
    ],
    "table": {
      "header": [
        "Mar'26",
        "Mar'25",
        "Change(%)"
      ],
      "body": [
        {
          "field": "Net Sales",
          "val1": "591.43",
          "val2": "442.72",
          "chgp": "33.59%",
          "chgp_class": "positive"
        },
        {
          "field": "Operating Profit (PBDIT) excl Other Income",
          "val1": "24.58",
          "val2": "19.89",
          "chgp": "23.58%",
          "chgp_class": "positive"
        },
        {
          "field": "Interest",
          "val1": "2.82",
          "val2": "1.75",
          "chgp": "61.14%",
          "chgp_class": "negative"
        },
        {
          "field": "Exceptional Items",
          "val1": "0.00",
          "val2": "0.00",
          "chgp": "",
          "chgp_class": "neutral"
        },
        {
          "field": "Standalone Net Profit",
          "val1": "16.76",
          "val2": "13.82",
          "chgp": "21.27%",
          "chgp_class": "positive"
        },
        {
          "field": "Operating Profit Margin (Excl OI)",
          "val1": "4.16%",
          "val2": "4.49%",
          "chgp": "-0.33%",
          "chgp_class": "negative"
        }
      ]
    }
  }
]

Quarterly Results Snapshot (Standalone) - Jun'26 - YoYstock-summary

Jun'26
Jun'25
Change(%)
Net Sales
190.00
111.54
70.34%
Operating Profit (PBDIT) excl Other Income
10.14
5.61
80.75%
Interest
0.51
0.64
-20.31%
Exceptional Items
0.00
0.00
Standalone Net Profit
6.82
3.58
90.50%
Operating Profit Margin (Excl OI)
5.34%
5.03%
0.31%
Values in Rs Cr.
Direction Arrows
Net Sales

YoY Growth in quarter ended Jun 2026 is 70.34% vs 6.41% in Jun 2025

Direction Arrows
Standalone Net Profit

YoY Growth in quarter ended Jun 2026 is 90.50% vs -1.92% in Jun 2025

Half Yearly Results Snapshot (Standalone) - Sep'25stock-summary

Sep'25
Sep'24
Change(%)
Net Sales
245.88
212.14
15.90%
Operating Profit (PBDIT) excl Other Income
11.21
10.62
5.56%
Interest
1.49
0.84
77.38%
Exceptional Items
0.00
0.00
Standalone Net Profit
7.31
7.30
0.14%
Operating Profit Margin (Excl OI)
4.56%
5.01%
-0.45%
Values in Rs Cr.
Direction Arrows
Net Sales

Growth in half year ended Sep 2025 is 15.90% vs 10.82% in Sep 2024

Direction Arrows
Standalone Net Profit

Growth in half year ended Sep 2025 is 0.14% vs 20.66% in Sep 2024

Nine Monthly Results Snapshot (Standalone) - Dec'25stock-summary

Dec'25
Dec'24
Change(%)
Net Sales
421.33
338.95
24.30%
Operating Profit (PBDIT) excl Other Income
18.56
15.97
16.22%
Interest
2.24
1.52
47.37%
Exceptional Items
0.00
0.00
Standalone Net Profit
12.22
10.88
12.32%
Operating Profit Margin (Excl OI)
4.41%
4.71%
-0.30%
Values in Rs Cr.
Direction Arrows
Net Sales

YoY Growth in nine months ended Dec 2025 is 24.30% vs 9.97% in Dec 2024

Direction Arrows
Standalone Net Profit

YoY Growth in nine months ended Dec 2025 is 12.32% vs 27.40% in Dec 2024

Annual Results Snapshot (Standalone) - Mar'26stock-summary

Mar'26
Mar'25
Change(%)
Net Sales
591.43
442.72
33.59%
Operating Profit (PBDIT) excl Other Income
24.58
19.89
23.58%
Interest
2.82
1.75
61.14%
Exceptional Items
0.00
0.00
Standalone Net Profit
16.76
13.82
21.27%
Operating Profit Margin (Excl OI)
4.16%
4.49%
-0.33%
Values in Rs Cr.
Direction Arrows
Net Sales

YoY Growth in year ended Mar 2026 is 33.59% vs 6.99% in Mar 2025

Direction Arrows
Standalone Net Profit

YoY Growth in year ended Mar 2026 is 21.27% vs 19.97% in Mar 2025

stock-summaryCompany CV
About Bhatia Communications & Retail (India) Ltd stock-summary
stock-summary
Bhatia Communications & Retail (India) Ltd
Micro Cap
Garments & Apparels
Bhatia Communications & Retail (India) Limited was incorporated as a Private Limited Company with the name "Bhatia Communications & Retail (India) Private Limited" on March 25, 2008. Consequent upon the conversion of Company to Public Limited, name of the Company was changed to `'Bhatia Communications & Retail (India) Limited" on January 17, 2018.
Company Coordinates stock-summary
Company Details
132 DrAmbedkar Shopping Centre, Ring Road Surat Gujarat : 395002
stock-summary
Tel: 91-261-2349892
stock-summary
info@bhatiamobile.com
Registrar Details
Purva Shareregistry (India) Pvt Ltd , Gala No 9, Shiv Shakti, Industrial Estate,Sitaram Mill Comp., J R Boricha Marg, Lower Parel [E], Mumbai