
Compare BigBear.ai Holdings, Inc. with Similar Stocks
Stock DNA
Software Products
USD 2,493 Million (Small Cap)
NA (Loss Making)
NA
0.00%
-0.79
-12.92%
4.09
Total Returns (Price + Dividend) 
BigBear.ai Holdings, Inc. for the last several years.
Risk Adjusted Returns v/s
News

BigBear.ai Stock Soars 16.11%, Hits Intraday High of $6.28
BigBear.ai Holdings, Inc. has seen a notable rise in its stock price, reaching an intraday high on November 24, 2025. Over the past year, the company has significantly outperformed the S&P 500, despite recent challenges, including a decline in one-month performance and negative financial metrics.
Read full news article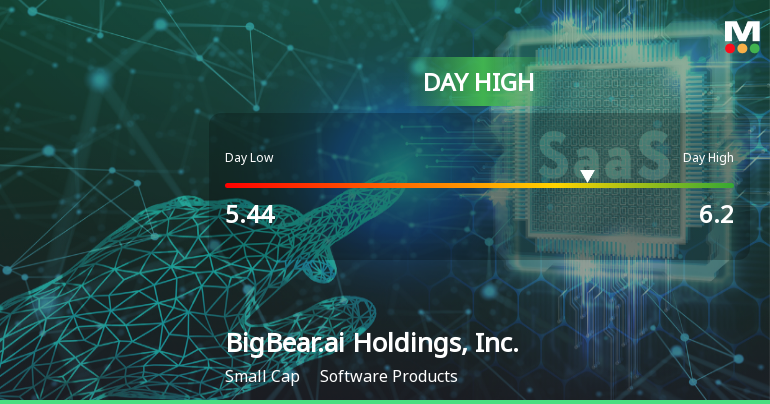
BigBear.ai Stock Soars to Day High with Strong Intraday Performance
BigBear.ai Holdings, Inc. has experienced significant stock price growth, with a notable year-over-year increase of 239.77%. Despite recent fluctuations, including a decline over the past month, the company has achieved a remarkable 510.89% increase over the last three years, with a market capitalization of USD 1,854 million.
Read full news article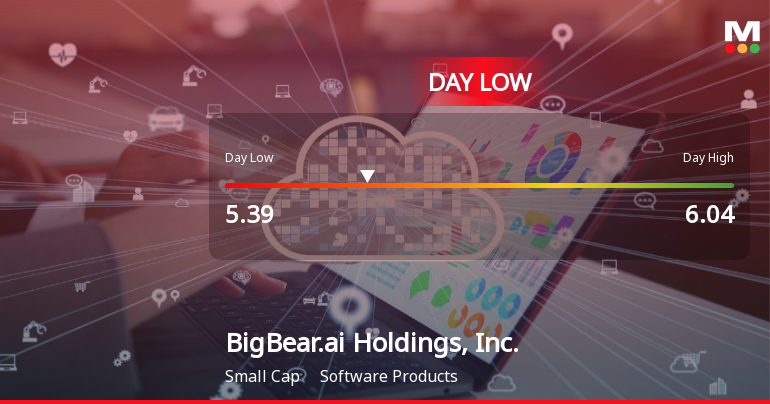
BigBear.ai Hits Day Low of $5.38 Amid Price Pressure
BigBear.ai Holdings, Inc. faced a notable decline in its stock price, reaching an intraday low amid a challenging trading environment. Despite recent struggles, the company has shown impressive growth over the past year. Financial metrics reveal pressures, including decreased net sales and rising raw material costs.
Read full news article Announcements

Corporate Actions
Quality key factors
Valuation key factors
Technicals key factors
 Technical Indicator Scale: Bearish, Mildly Bearish, Sideways, Mildly Bullish, Bullish Turned
 Shareholding Snapshot : Sep 2025
Shareholding Compare (%holding)
Domestic Funds
Held in 22 Schemes (12.02%)
Held by 67 Foreign Institutions (2.4%)
Quarterly Results Snapshot (Consolidated) - Jun'25 - QoQ

QoQ Growth in quarter ended Jun 2025 is -6.61% vs -20.55% in Mar 2025

QoQ Growth in quarter ended Jun 2025 is -268.71% vs 42.59% in Mar 2025
Annual Results Snapshot (Consolidated) - Dec'24
YoY Growth in year ended Dec 2024 is 1.93% vs 0.13% in Dec 2023
YoY Growth in year ended Dec 2024 is -317.96% vs 41.91% in Dec 2023
About BigBear.ai Holdings, Inc.

Company Coordinates


