
Compare Bikaji Foods with Similar Stocks
Dashboard
Flat results in Mar 26
- PBT LESS OI(Q) At Rs 59.54 cr has Fallen at -15.8% (vs previous 4Q average)
- PAT(Q) At Rs 56.41 cr has Fallen at -9.6% (vs previous 4Q average)
With ROE of 16.3, it has a Expensive valuation with a 10 Price to Book Value
Underperformed the market in the last 1 year
Total Returns (Price + Dividend) 
Latest dividend: 1 per share ex-dividend date: Aug-29-2025
Risk Adjusted Returns v/s
Returns Beta

News

Bikaji Foods International Ltd is Rated Sell
Bikaji Foods International Ltd is rated Sell by MarketsMOJO, with this rating last updated on 18 June 2026. While the rating was revised on that date, the analysis and financial metrics discussed here reflect the company’s current position as of 11 July 2026, providing investors with the latest insights into the stock’s fundamentals, valuation, financial trends, and technical outlook.
Read full news article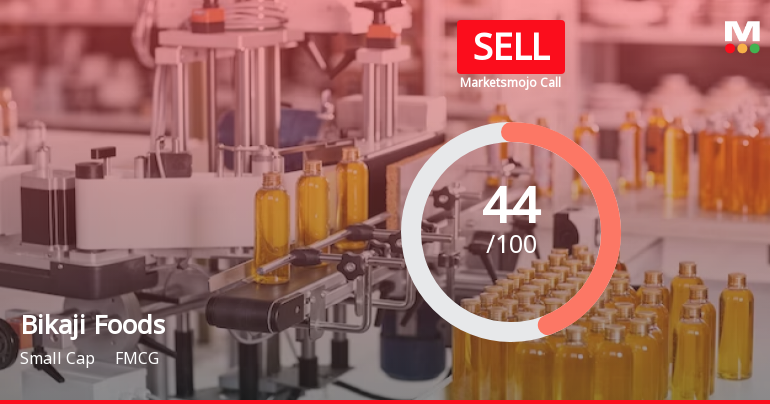
Bikaji Foods International Ltd is Rated Sell
Bikaji Foods International Ltd is rated Sell by MarketsMOJO, with this rating last updated on 18 June 2026. While the rating was revised on that date, the analysis and financial metrics discussed here reflect the stock's current position as of 30 June 2026, providing investors with an up-to-date perspective on the company’s performance and outlook.
Read full news article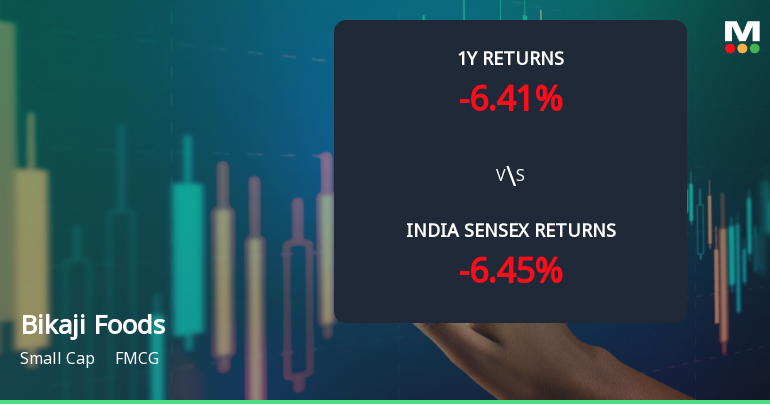
Bikaji Foods International Ltd Technical Momentum Shifts Amid Mixed Indicators
Bikaji Foods International Ltd, a small-cap player in the FMCG sector, has experienced a subtle shift in its technical momentum, moving from a sideways trend to a mildly bearish stance. Despite a near-flat day change, a detailed analysis of key technical indicators such as MACD, RSI, Bollinger Bands, and moving averages reveals a complex picture that investors should carefully consider amid the stock’s recent performance and broader market context.
Read full news article Announcements
Corporate Actions

No Upcoming Board Meetings

Bikaji Foods International Ltd has declared 125% dividend, ex-date: 17 Jul 26

No Splits history available

No Bonus history available

No Rights history available
Quality key factors
Valuation key factors
Technicals key factors
 Technical Indicator Scale: Bearish, Mildly Bearish, Sideways, Mildly Bullish, Bullish Turned
 Shareholding Snapshot : Mar 2026
Shareholding Compare (%holding)
Promoters
None
Held by 27 Schemes (11.94%)
Held by 83 FIIs (4.68%)
Shiv Ratan Agarwal (33.72%)
Quant Mutual Fund - Quant Small Cap Fund (3.66%)
3.51%
Quarterly Results Snapshot (Consolidated) - Mar'26 - QoQ

QoQ Growth in quarter ended Mar 2026 is -8.75% vs -4.85% in Dec 2025

QoQ Growth in quarter ended Mar 2026 is -9.28% vs -22.06% in Dec 2025
Half Yearly Results Snapshot (Consolidated) - Sep'25
Growth in half year ended Sep 2025 is 14.66% vs 18.57% in Sep 2024
Growth in half year ended Sep 2025 is 9.36% vs 24.19% in Sep 2024
Nine Monthly Results Snapshot (Consolidated) - Dec'25
YoY Growth in nine months ended Dec 2025 is 13.18% vs 17.10% in Dec 2024
YoY Growth in nine months ended Dec 2025 is 29.15% vs 4.57% in Dec 2024
Annual Results Snapshot (Consolidated) - Mar'26
YoY Growth in year ended Mar 2026 is 14.33% vs 12.42% in Mar 2025
YoY Growth in year ended Mar 2026 is 28.58% vs -24.41% in Mar 2025
About Bikaji Foods International Ltd

Company Coordinates


