
Compare Billionbrains with Similar Stocks
Dashboard
Strong Long Term Fundamental Strength with an average Return on Equity (ROE) of 0%
- Healthy long term growth as Net Sales has grown by an annual rate of 0% and Operating profit at 0%
With a growth in Net Profit of 2.54%, the company declared Very Positive results in Jun 26
With ROE of 21.6, it has a Very Expensive valuation with a 12.6 Price to Book Value
Increasing Participation by Institutional Investors
Stock DNA
Capital Markets
INR 120,610 Cr (Large Cap)
50.00
21
0.00%
0.03
21.58%
12.64
Total Returns (Price + Dividend) 
Billionbrains for the last several years.
Risk Adjusted Returns v/s
Returns Beta

News
Billionbrains Garage Ventures Ltd Sees Exceptional Volume Surge Amid Market Recovery
Billionbrains Garage Ventures Ltd (GROWW), a large-cap player in the capital markets sector, witnessed a remarkable surge in trading volume on 31 Jul 2026, signalling renewed investor interest following a week-long decline. The stock outperformed its sector and broader market indices, supported by strong liquidity and positive accumulation signals, despite a recent downgrade in its Mojo Grade from Buy to Hold.
Read full news article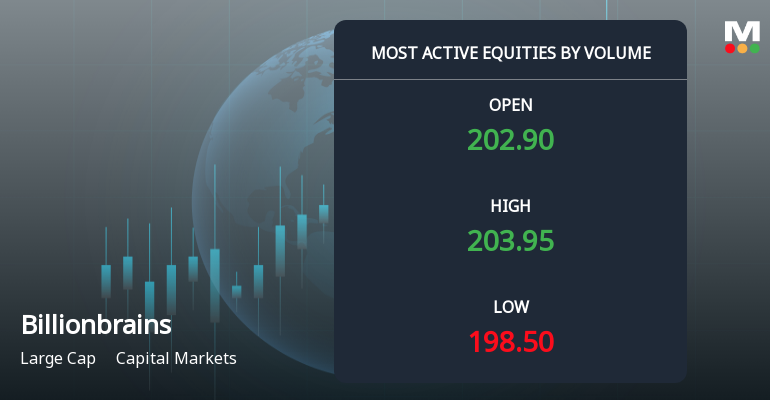
Billionbrains Garage Ventures Ltd Sees High Volume Amid Mixed Price Action and Downgrade
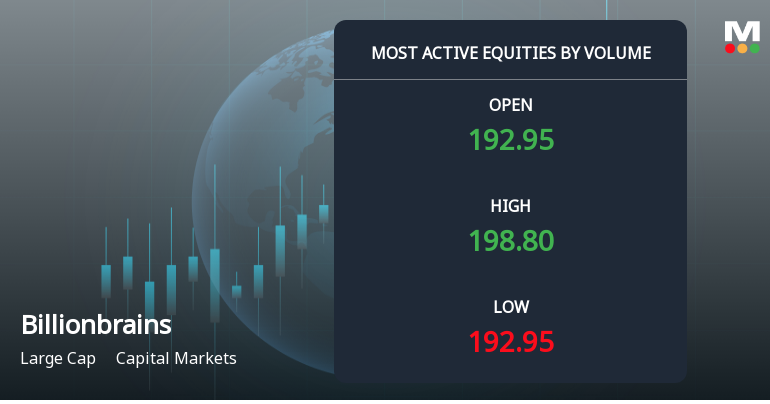
Billionbrains Garage Ventures Ltd (GROWW), a large-cap player in the capital markets sector, has emerged as one of the most actively traded stocks by volume on 27 Jul 2026, registering a total traded volume of 1.70 crore shares worth ₹341.67 crores. Despite this surge in activity, the stock has experienced a modest decline in price, reflecting a complex interplay of investor sentiment and market dynamics.
Read full news article
Billionbrains Garage Ventures Ltd is Rated Hold
Billionbrains Garage Ventures Ltd is rated 'Hold' by MarketsMOJO, with this rating last updated on 20 July 2026. While the rating was revised on that date, the analysis below reflects the stock’s current fundamentals, returns, and financial metrics as of 27 July 2026, providing investors with an up-to-date perspective on the company’s standing.
Read full news article Announcements
Corporate Actions

No Upcoming Board Meetings

No Dividend history available

No Splits history available

No Bonus history available

No Rights history available
Quality key factors
Valuation key factors
Technicals key factors
 Technical Indicator Scale: Bearish, Mildly Bearish, Sideways, Mildly Bullish, Bullish Turned
 Shareholding Snapshot : Jun 2026
Shareholding Compare (%holding)
Non Institution
1.3121
Held by 34 Schemes (8.69%)
Held by 248 FIIs (6.89%)
Lalit Keshre (8.58%)
Peak Xv Partners Investments Vi-1 (15.68%)
4.94%
Quarterly Results Snapshot (Standalone) - Jun'26 - QoQ

QoQ Growth in quarter ended Jun 2026 is -0.97% vs 22.66% in Mar 2026
QoQ Growth in quarter ended Jun 2026 is 2.54% vs 26.36% in Mar 2026
Half Yearly Results Snapshot (Standalone) - Sep'25
Not Applicable: The company has declared_date for only one period
Not Applicable: The company has declared_date for only one period
Nine Monthly Results Snapshot (Standalone) - Dec'25
Not Applicable: The company has declared_date for only one period
Not Applicable: The company has declared_date for only one period
Annual Results Snapshot (Consolidated) - Mar'26
YoY Growth in year ended Mar 2026 is 19.04% vs 49.53% in Mar 2025
YoY Growth in year ended Mar 2026 is 14.18% vs 326.65% in Mar 2025
About Billionbrains Garage Ventures Ltd

Company Coordinates


