
Dashboard
Strong Long Term Fundamental Strength with an average Return on Equity (ROE) of 0%
Healthy long term growth as Net Sales has grown by an annual rate of 0% and Operating profit at 0%
With a growth in Operating Profit of 27.29%, the company declared Very Positive results in Mar 26
Majority shareholders : Non Institution
Stock DNA
Capital Markets
INR 123,558 Cr (Mid Cap)
60.00
21
0.00%
0.03
21.58%
12.62
Total Returns (Price + Dividend) 
Billionbrains for the last several years.
Risk Adjusted Returns v/s
Returns Beta

News
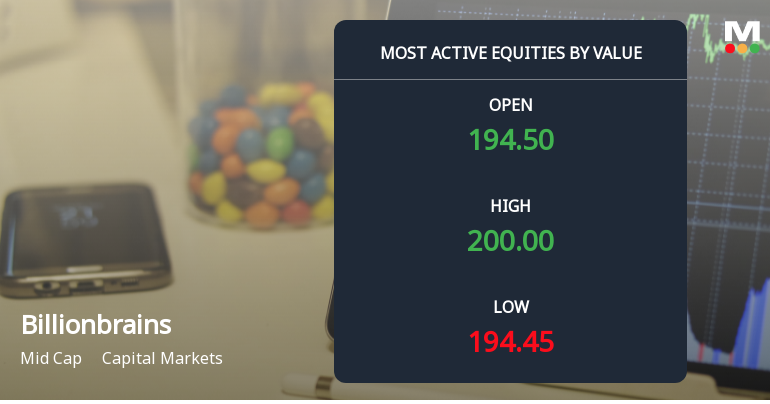
Billionbrains Garage Ventures Ltd Sees Robust Trading Activity Amid Positive Momentum
Billionbrains Garage Ventures Ltd (GROWW) has emerged as one of the most actively traded stocks by value on 24 June 2026, reflecting renewed investor interest and a positive shift in market sentiment. The mid-cap capital markets company recorded a total traded volume of 87.39 lakh shares, translating into a substantial traded value of ₹172.84 crores, underscoring its liquidity and appeal among institutional and retail participants alike.
Read full news article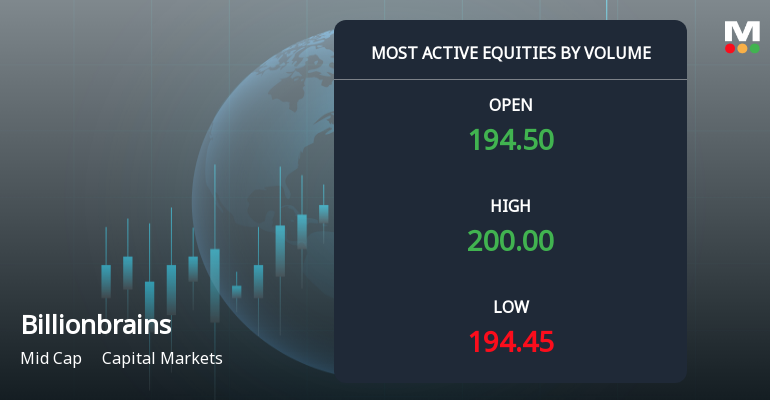
Billionbrains Garage Ventures Ltd Sees Exceptional Volume Surge Amid Positive Momentum
Billionbrains Garage Ventures Ltd (GROWW) has emerged as one of the most actively traded stocks in the capital markets sector on 24 June 2026, registering a remarkable surge in trading volume and demonstrating a positive price reversal after a brief decline. The stock’s performance today outpaced its sector peers and the broader Sensex, signalling renewed investor interest and accumulation potential in this mid-cap company.
Read full news article
Billionbrains Garage Ventures Ltd is Rated Buy
Billionbrains Garage Ventures Ltd is rated Buy by MarketsMOJO, with this rating last updated on 15 June 2026. However, the analysis and financial metrics discussed here reflect the company’s current position as of 21 June 2026, providing investors with the most up-to-date insight into the stock’s fundamentals, valuation, financial trends, and technical outlook.
Read full news article Announcements
Grant Of Options Under Billionbrains Garage Ventures Limited Employee Stock Option Scheme 2024.
08-Jun-2026 | Source : BSERevised intimation of Grant of Stock option - Correction in date of grant
Grant Of ESOP Options Under Billionbrains Garage Ventures Limited Employee Stock Option Scheme 2024
02-Jun-2026 | Source : BSEGrant of 274214 options under BGV ESOP Scheme 2024
Intimation Under Regulation 30 Of SEBI Listing Regulation
01-Jun-2026 | Source : BSEThe Company would like to inform that SEBI has taken on record the proposed transaction as mentioned in the attachment.
Corporate Actions

No Upcoming Board Meetings

No Dividend history available

No Splits history available

No Bonus history available

No Rights history available
Quality key factors
Valuation key factors
Technicals key factors
 Technical Indicator Scale: Bearish, Mildly Bearish, Sideways, Mildly Bullish, Bullish Turned
 Shareholding Snapshot : Mar 2026
Shareholding Compare (%holding)
Non Institution
1.3007
Held by 28 Schemes (5.25%)
Held by 83 FIIs (2.51%)
Lalit Keshre (9.06%)
Peak Xv Partners Investments Vi-1 (17.16%)
4.32%
Quarterly Results Snapshot (Standalone) - Mar'26 - QoQ

QoQ Growth in quarter ended Mar 2026 is 22.66% vs 14.11% in Dec 2025
QoQ Growth in quarter ended Mar 2026 is 26.35% vs 21.02% in Dec 2025
Half Yearly Results Snapshot (Standalone) - Sep'25
Not Applicable: The company has declared_date for only one period
Not Applicable: The company has declared_date for only one period
Nine Monthly Results Snapshot (Standalone) - Dec'25
Not Applicable: The company has declared_date for only one period
Not Applicable: The company has declared_date for only one period
Annual Results Snapshot (Consolidated) - Mar'26

YoY Growth in year ended Mar 2026 is 19.04% vs 49.53% in Mar 2025
YoY Growth in year ended Mar 2026 is 14.18% vs 326.65% in Mar 2025
About Billionbrains Garage Ventures Ltd

Company Coordinates


