
Compare Binayaka Tex Pr with Similar Stocks
Stock DNA
Garments & Apparels
INR 112 Cr (Micro Cap)
37.00
52
0.00%
0.38
3.22%
1.14
Total Returns (Price + Dividend) 
Latest dividend: 2 per share ex-dividend date: Sep-22-2016
Risk Adjusted Returns v/s
Returns Beta

News

Binayaka Tex Processors Ltd is Rated Strong Sell
Binayaka Tex Processors Ltd is rated Strong Sell by MarketsMOJO. This rating was last updated on 26 May 2026, reflecting a significant reassessment of the stock’s outlook. However, all fundamentals, returns, and financial metrics discussed below are based on the company’s current position as of 08 July 2026, providing investors with the latest insights into its performance and prospects.
Read full news article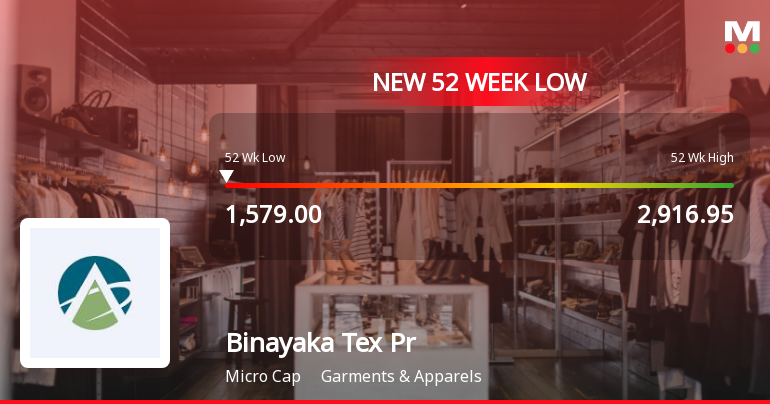
Binayaka Tex Processors Ltd Falls to 52-Week Low of Rs 1579 as Sell-Off Deepens
For the fifth consecutive session, Binayaka Tex Processors Ltd closed lower, hitting a fresh 52-week low of Rs 1579 on 2 Jul 2026. This decline comes amid a broader market rally, with the Sensex trading 0.28% higher, underscoring a stark divergence in performance.
Read full news article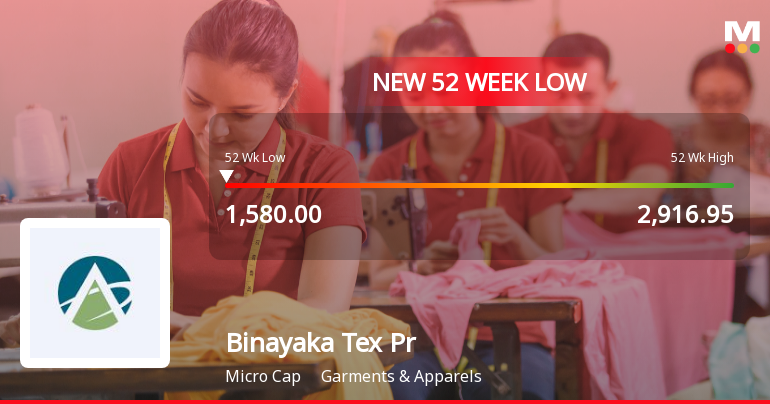
Binayaka Tex Processors Ltd Falls to 52-Week Low of Rs 1580 as Sell-Off Deepens
For the second consecutive session, Binayaka Tex Processors Ltd has seen its share price decline, culminating in a fresh 52-week low of Rs 1580 on 1 Jul 2026. This drop comes amid a broader market rally, highlighting a stark divergence in performance.
Read full news article Announcements
Compliances-Certificate under Reg. 74 (5) of SEBI (DP) Regulations 2018
09-Jul-2026 | Source : BSECertificate under Regulation 74(5) of SEBI (DP) Regulations 2018 for the quarter ended 30th June 2026
Closure of Trading Window
07-Jul-2026 | Source : BSEIntimation of Closure of Trading Window under clause 4 of schedule B SEBI ( Prohibition of Insider Trading) Regulation 2015
Financial Result As On 31St March 2026
10-Jun-2026 | Source : BSEFinancial Result as on 31st March 2026
Corporate Actions

No Upcoming Board Meetings

Binayaka Tex Processors Ltd has declared 20% dividend, ex-date: 18 Sep 15

No Splits history available

No Bonus history available

No Rights history available
Quality key factors
Valuation key factors
Technicals key factors
 Technical Indicator Scale: Bearish, Mildly Bearish, Sideways, Mildly Bullish, Bullish Turned
 Shareholding Snapshot : Jun 2026
Shareholding Compare (%holding)
Promoters
None
Held by 0 Schemes
Held by 0 FIIs
Vanshika Pacheriwala (11.96%)
Harit Exports Private Limited (7.03%)
31.71%
Quarterly Results Snapshot (Standalone) - Mar'26 - QoQ

QoQ Growth in quarter ended Mar 2026 is -13.27% vs 5.76% in Dec 2025
QoQ Growth in quarter ended Mar 2026 is -151.91% vs 92.63% in Dec 2025
Half Yearly Results Snapshot (Standalone) - Sep'25

Growth in half year ended Sep 2025 is 3.07% vs -1.16% in Sep 2024
Growth in half year ended Sep 2025 is 39.24% vs -46.26% in Sep 2024
Nine Monthly Results Snapshot (Standalone) - Dec'25
YoY Growth in nine months ended Dec 2025 is 14.69% vs 5.97% in Dec 2024
YoY Growth in nine months ended Dec 2025 is 232.95% vs -61.23% in Dec 2024
Annual Results Snapshot (Standalone) - Mar'26
YoY Growth in year ended Mar 2026 is 12.80% vs 5.50% in Mar 2025
YoY Growth in year ended Mar 2026 is -10.79% vs -50.00% in Mar 2025
About Binayaka Tex Processors Ltd

Company Coordinates


