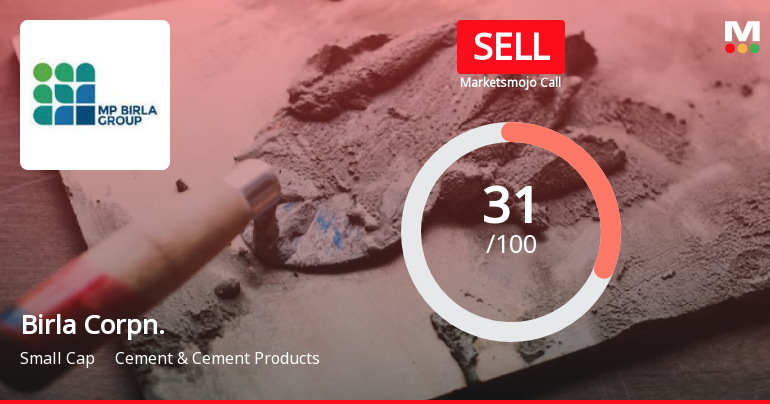
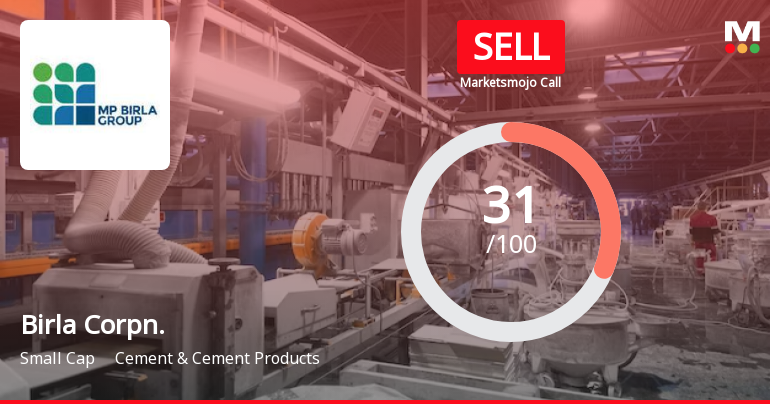
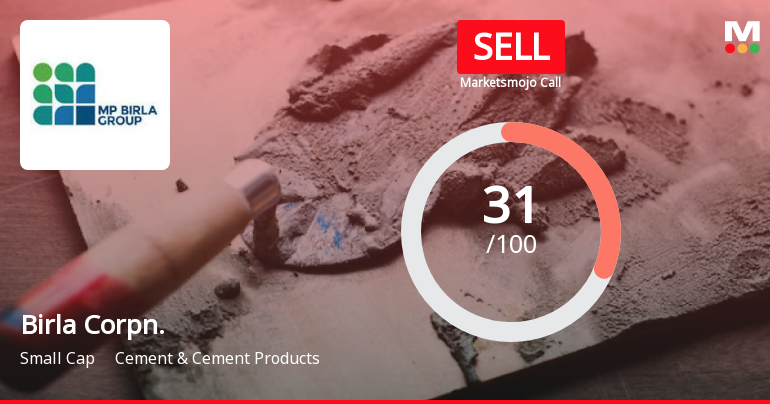
Birla Corpn.

  • Market Cap: Small Cap
  • Industry: Cement & Cement Products
  • ISIN: INE340A01012
  • NSEID: BIRLACORPN
  • BSEID: 500335
INR
823.20
10.6 (1.3%)
BSENSE

Sep 18, 03:30 PM

BSE+NSE Vol: 2.17 lacs

  • Price Points
  • Score
  • Mojo Parameters
  • Total Return
  • News and Corporate Actions
  • Key factors
  • Shareholding
  • Financials
  • CompanyCV
stock-summaryPrice Point
High/Low

1Day

52 Week

Valuation
Technical
Day's Volume

CASH

2.17 lacs (136.52%) Volume

Shareholding (Jun 2026)

FII

6.13%

Held by 109 FIIs

DII

16.97%

Held by 22 DIIs

Promoter

62.90%

Which are the latest news on Birla Corpn.?

18-Sep-2026

Why is Birla Corporation Ltd falling/rising?

06-Sep-2026

As of 05-Sep, Birla Corporation Ltd's stock price is rising to 889.80, reflecting a short-term gain of 2.89%. However, the long-term outlook is challenging with a -31.22% return over the past year and declining operating profits.

As of 05-Sep, Birla Corporation Ltd's stock price is rising, currently at 889.80, with a change of 5.45 (0.62%) upward. This increase can be attributed to a few key factors. Firstly, the stock has been gaining for the last two days, showing a cumulative return of 2.89% during this period. Additionally, the stock is currently trading at a discount compared to its peers' average historical valuations, which may attract investors looking for value opportunities.<BR><BR>Despite the positive short-term movement, it is important to note that the stock has faced significant challenges over the longer term. Over the past year, it has generated a return of -31.22%, and its operating profit has declined at an annual rate of -3.20% over the last five years. Furthermore, the stock's performance has been below par compared to the BSE500 index in various time frames, indicating ongoing struggles in the market.<BR><BR>The company's fundamentals show some positive aspects, such as a return on capital employed (ROCE) of 9.7 and high institutional holdings at 23.1%, suggesting that larger investors have confidence in the company's potential. However, the falling investor participation, with delivery volume decreasing by 37.88% against the five-day average, raises concerns about the stock's liquidity and overall market interest.<BR><BR>In summary, while Birla Corporation Ltd is experiencing a short-term rise in stock price, the long-term outlook remains challenging due to poor growth metrics and underperformance relative to broader market indices.

View full answer

Who are in the management team of Birla Corpn.?

01-Sep-2026

The management team of Birla Corporation includes H V Lodha (Chairman), Sandip Ghose (Managing Director & CEO), and Manoj Kumar Mehta (Company Secretary), along with several independent directors responsible for guiding the company's strategy and operations.

The management team of Birla Corporation includes the following key members:<BR><BR>1. **H V Lodha** - Chairman (Non-Executive) & Director (Non-Independent)<BR>2. **Sandip Ghose** - Managing Director & CEO<BR>3. **Manoj Kumar Mehta** - Company Secretary / Legal Head<BR><BR>Additionally, the board features several independent directors:<BR><BR>- **Vikram Swarup** - Independent Non-Executive Director<BR>- **Anand Bordia** - Independent Non-Executive Director<BR>- **D N Ghosh** - Independent Non-Executive Director<BR>- **Deepak Nayyar** - Independent Non-Executive Director<BR>- **Shailaja Chandra** - Independent Non-Executive Director<BR>- **Anup Singh** - Independent Director<BR>- **Chitkala Zutshi** - Independent Director<BR>- **Rajni Sekhri Sibal** - Independent Director<BR>- **Rajeev Malhotra** - Independent Director<BR>- **Dilip G Karnik** - Non-Executive & Non-Independent Director<BR><BR>This team is responsible for guiding the company's strategic direction and overseeing its operations.

View full answer

What does Birla Corpn. do?

01-Sep-2026

Birla Corporation Ltd is a small-cap company primarily engaged in cement manufacturing, with net sales of ₹2,646 Cr and a net profit of ₹116 Cr reported for June 2026. Key metrics include a P/E ratio of 12.00, a dividend yield of 2.47%, and a market cap of ₹6,766 Cr.

Overview:<BR>Birla Corporation Ltd is primarily engaged in the manufacturing of cement and operates within the Cement & Cement Products industry, categorized as a Small Cap company.<BR><BR>History:<BR>Birla Corporation Limited was incorporated in 1919 as Birla Jute Manufacturing Company Limited. The latest quarterly results reported net sales and net profit for June 2026.<BR><BR>Financial Snapshot:<BR>- Net Sales: 2,646 Cr (Quarterly Results - Jun 2026)<BR>- Net Profit: 116 Cr (Quarterly Results - Jun 2026)<BR>- Market cap: INR 6,766 Cr (Small Cap)<BR><BR>Key Metrics:<BR>- P/E: 12.00<BR>- Industry P/E: 33<BR>- Dividend Yield: 2.47%<BR>- Debt Equity: 0.30<BR>- Return on Equity: 7.59%<BR>- Price to Book: 0.95<BR><BR>Contact Details:<BR>Address: Birla Building 3rd & 4th Floor, 9/1 R N Mukherjee Road Kolkata West Bengal : 700001<BR>Tel: 91-033-66166726/6737/6738<BR>Email: investorsgrievance@birlacorp.com<BR>Website: http://www.birlacorporation.com

View full answer

Who are the peers of the Birla Corpn.?

01-Sep-2026

Birla Corporation's peers include Ramco Cement, JSW Cement, Nuvoco Vistas, India Cements, Star Cement, JK Lakshmi Cement, Prism Johnson, Heidelberg Cement, and Mangalam Cement. Management risk varies, with Birla Corp. and others rated average, while Mangalam Cement leads in 1-year returns at 52.02%, and Birla Corp. has a return of -30.27%.

Peers: The Ramco Cement, JSW Cement, Nuvoco Vistas, India Cements, Star Cement, Birla Corpn., JK Lakshmi Cem., Prism Johnson, Heidelberg Cem., Mangalam Cement.<BR><BR>Quality Snapshot: Excellent management risk is observed at JK Lakshmi Cem. and Heidelberg Cem., while Average management risk is found at The Ramco Cement, Nuvoco Vistas, India Cements, Star Cement, Birla Corpn., and Prism Johnson, and the rest. Below Average management risk is present at JSW Cement, Mangalam Cement, and Orient Cement. Good growth is seen at JSW Cement and JK Lakshmi Cem., while Below Average growth is noted at The Ramco Cement, Nuvoco Vistas, India Cements, Star Cement, Birla Corpn., Prism Johnson, Heidelberg Cem., Mangalam Cement, and Orient Cement. <BR><BR>Return Snapshot: Mangalam Cement has the highest 1-year return at 52.02%, while JK Lakshmi Cem. has the lowest at -42.30%, with Birla Corpn.'s return at -30.27% being significantly lower than Mangalam Cement's. Additionally, the six-month return is negative for The Ramco Cement, JSW Cement, Nuvoco Vistas, India Cements, Star Cement, Birla Corpn., JK Lakshmi Cem., and Orient Cement.

View full answer

How big is Birla Corpn.?

01-Sep-2026

As of 31st August, Birla Corporation Ltd has a market capitalization of 6,766.00 Cr, with recent net sales of 9,847.84 Cr and a net profit of 553.75 Cr.

As of 31st August, Birla Corporation Ltd has a market capitalization of 6,766.00 Cr, categorizing it as a Small Cap company.<BR><BR>In the latest four quarters, Birla Corporation Ltd reported Net Sales of 9,847.84 Cr and a Net Profit of 553.75 Cr.<BR><BR>The latest annual period for the balance sheet is March 2026, showing Shareholder's Funds of 7,364.70 Cr and Total Assets of 14,510.06 Cr.

View full answer

Are Birla Corporation Ltd latest results good or bad?

26-Jul-2026

Birla Corporation Ltd's latest results are unfavorable, showing a 60.74% decline in net profit compared to the previous quarter and a contraction in operating margins to 12.93%, despite a year-on-year revenue growth of 7.83%. This indicates significant operational challenges and concerns about the company's profitability and competitive positioning in the cement sector.

Birla Corporation Ltd's latest results indicate a challenging quarter for the company. The net profit for Q1 FY27 was ₹115.73 crore, which represents a significant decline of 60.74% compared to the previous quarter and a slight decrease of 3.21% year-on-year. This sharp drop in profitability raises concerns about the sustainability of earnings in the near term.<BR><BR>While the company reported a year-on-year revenue growth of 7.83%, the quarter-on-quarter revenue fell by 6.69%, reflecting typical seasonal patterns in the cement industry. The operating margin also saw a notable contraction, dropping to 12.93%, the lowest in eight quarters, which indicates severe margin compression due to pricing pressures and elevated input costs.<BR><BR>Overall, the results highlight significant operational challenges, with deteriorating margins and profitability overshadowing the revenue growth. This situation raises questions about the company's competitive positioning and ability to navigate the current market environment effectively. Therefore, the latest results can be characterized as unfavorable, reflecting ongoing difficulties in the cement sector.

View full answer

Should I buy, sell or hold Birla Corporation Ltd?

26-Jul-2026

When is the next results date for Birla Corporation Ltd?

23-Jan-2026

The next results date for Birla Corporation Ltd is January 31, 2026.

The next results date for Birla Corporation Ltd is scheduled for January 31, 2026.

View full answer

Is Birla Corpn. technically bullish or bearish?

19-Nov-2025

As of November 18, 2025, the market trend has shifted to a moderate bearish stance, driven by bearish signals from MACD, KST, and moving averages, despite mild bullishness in the OBV.

As of 18 November 2025, the technical trend has changed from mildly bearish to bearish. The current stance is bearish with a moderate strength. Key indicators driving this include bearish signals from both the MACD and KST on weekly and monthly time frames, along with bearish moving averages on the daily chart. The Bollinger Bands also indicate a mildly bearish trend on both weekly and monthly levels. Although the OBV shows mild bullishness on the weekly, it does not outweigh the overall bearish sentiment reflected in the other indicators.

View full answer

How has been the historical performance of Birla Corpn.?

18-Nov-2025

Birla Corporation's historical performance shows a decline in net sales, operating profit, and profit after tax from March 2024 to March 2025, despite a slight improvement in cash flow from operating activities. Total assets and liabilities remained stable during this period.

Answer:<BR>The historical performance of Birla Corporation shows a fluctuating trend in various financial metrics over the years.<BR><BR>Breakdown:<BR>Birla Corporation's net sales peaked at 9,656.22 Cr in March 2024 but declined to 9,214.49 Cr by March 2025. The total operating income followed a similar trend, reaching 9,656.22 Cr in March 2024 and then decreasing to 9,214.49 Cr in March 2025. The operating profit (PBDIT) also saw a decline from 1,523.17 Cr in March 2024 to 1,315.13 Cr in March 2025. Profit before tax dropped significantly from 579.93 Cr in March 2024 to 377.85 Cr in March 2025, contributing to a decrease in profit after tax from 420.56 Cr to 295.22 Cr in the same period. The company's total liabilities slightly decreased from 14,436.17 Cr in March 2024 to 14,330.93 Cr in March 2025, while total assets also saw a minor decline from 14,436.17 Cr to 14,330.93 Cr. Cash flow from operating activities improved to 1,669.00 Cr in March 2025 from 1,620.00 Cr in March 2024, although the net cash outflow was recorded at -38.00 Cr in March 2025 compared to -49.00 Cr in March 2024. Overall, the financial performance indicates a mixed trend with some areas of decline, particularly in profitability, while maintaining a stable asset and liability structure.

View full answer

Who are the top shareholders of the Birla Corpn.?

17-Jul-2025

The top shareholders of Birla Corporation include promoters, with Hindustan Medical Institution holding 9.3%, mutual funds at 13.92%, foreign institutional investors at 6.27%, and individual investors owning 11.29%. The largest public shareholder is Nippon Life India Trustee Ltd, with a 3.7% stake.

The top shareholders of Birla Corporation include a mix of promoters and institutional investors. The majority shareholders are the promoters, with Hindustan Medical Institution holding the highest stake at 9.3%. Additionally, mutual funds collectively hold 13.92% of the shares across 15 schemes, while foreign institutional investors (FIIs) account for 6.27% through 102 different entities. The highest public shareholder is Nippon Life India Trustee Ltd, which holds 3.7% of the shares in various schemes. Individual investors also have a significant presence, owning 11.29% of the company.

View full answer

Is Birla Corpn. overvalued or undervalued?

09-Jun-2025

As of March 24, 2025, Birla Corporation is considered fairly valued with a PE ratio of 32.80, an EV to EBITDA of 10.95, and a ROE of 4.64%, while outperforming the Sensex with a 30.98% return over the past month, though it remains competitively priced against peers like UltraTech Cement and Grasim Industries.

As of 24 March 2025, Birla Corporation's valuation grade has moved from very attractive to attractive, indicating a shift in its perceived value. The company is currently considered fairly valued. Key ratios include a PE ratio of 32.80, an EV to EBITDA of 10.95, and a ROE of 4.64%. <BR><BR>When compared to peers, Birla Corporation's PE ratio is lower than UltraTech Cement's 52.27 and Grasim Industries' 43.9, both of which are classified as very expensive and attractive, respectively. This suggests that while Birla Corporation is priced attractively within its industry, it still faces competition from peers with higher valuations. Additionally, the company's recent stock performance has outpaced the Sensex over the past month, with a return of 30.98% compared to the Sensex's 3.89%, reinforcing its competitive positioning in the market.

View full answer

Has Birla Corpn. declared dividend?

06-Jun-2025

Yes, Birla Corporation Ltd has declared a 100% dividend, amounting to ₹10 per share, with an ex-date of July 29, 2024. The dividend yield is 0.73%, and total returns have varied across different periods, showing stronger performance over the long term.

Birla Corporation Ltd has declared a 100% dividend.<BR><BR>Dividend Details:<BR>- Percentage announced: 100%<BR>- Amount per share: 10<BR>- Ex-date: 29 Jul 24<BR><BR>Dividend Yield: 0.73%.<BR><BR>Total Returns by Period:<BR>In the last 6 months, the price return was 6.89%, with a dividend return of 0%, resulting in a total return of 6.89%.<BR><BR>Over the past year, the price return was -4.56%, the dividend return was 0.66%, leading to a total return of -3.9%.<BR><BR>In the last 2 years, the price return was 15.37%, with a dividend return of 1.05%, culminating in a total return of 16.42%.<BR><BR>For the 3-year period, the price return was 55.93%, the dividend return was 2.70%, which resulted in a total return of 58.63%.<BR><BR>In the last 4 years, the price return was 12.19%, with a dividend return of 2.62%, leading to a total return of 14.81%.<BR><BR>Over the past 5 years, the price return was 155.94%, the dividend return was 6.66%, resulting in a total return of 162.6%.<BR><BR>Overall, Birla Corporation Ltd has declared a significant dividend, which, combined with varying total returns over different periods, indicates a generally positive performance, especially over the longer term. The dividend yield is modest, suggesting that while the company is rewarding shareholders, the returns may vary significantly based on market conditions.

View full answer
iScoreScore
Click here to find our call on this stock
Strong Sell
Sell
Hold
Buy
Strong Buy

Dashboard

1

Poor long term growth as Operating profit has grown by an annual rate -3.20% of over the last 5 years

  • OPERATING CF(Y) Lowest at Rs 314.66 Cr
  • PBT LESS OI(Q) At Rs 132.74 cr has Fallen at -19.3% (vs previous 4Q average)
  • PAT(Q) At Rs 115.73 cr has Fallen at -17.2% (vs previous 4Q average)
2

Consistent Underperformance against the benchmark over the last 3 years

stock-summaryMojo Parameters

Mojo Parameters

Loading Valuation Snapshot...

Stock DNA

stock-summary
Industry

Cement & Cement Products

stock-summary
Market cap

INR 6,250 Cr (Small Cap)

stock-summary
P/E

11.00

stock-summary
Industry P/E

31

stock-summary
Dividend Yield

1.53%

stock-summary
Debt Equity

0.30

stock-summary
Return on Equity

7.59%

stock-summary
Price to Book

0.85

Revenue and Profits:
Net Sales:
2,646 Cr
(Quarterly Results - Jun 2026)
Net Profit:
116 Cr
stock-summaryTotal Returns
Total Returns (Price + Dividend) stock-summary
Dividend Yield (1.53%)
TimePeriod
Price Return
Dividend Return
Total Return
3 Months
-21.52%
1.22%
-20.3%
6 Months
-3.26%
1.53%
-1.73%
1 Year
-35.84%
0.96%
-34.88%
2 Years
-37.53%
1.76%
-35.77%
3 Years
-32.22%
2.58%
-29.64%
4 Years
-24.05%
3.75%
-20.3%
5 Years
-36.9%
3.10%
-33.8%

Latest dividend: 12.320876288659793 per share ex-dividend date: Jul-24-2026

Risk Adjusted Returns v/s stock-summary
Returns Beta
Icon
Beta has not been calculated since enough price history is not available
stock-summaryNews & Corporate Actions

Announcements stock-summary

Announcement under Regulation 30 (LODR)-Issue of Securities

15-Sep-2026 | Source : BSE

Issuance and allotment of Commercial Paper aggregating to ?50 crore.

Redemption Of Non-Convertible Debenture

14-Sep-2026 | Source : BSE

Intimation of redemption of Non-Convertible Debenture (Series-VII) on due date of maturity i.e. 14th September 2026 along with payment of applicable interest.

Announcement under Regulation 30 (LODR)-Change in Management

09-Sep-2026 | Source : BSE

This is to inform you that Shri Kalidas Pramanik Chief Marketing Officer and Senior Management Personnel of the Company had requested for early superannuation from the employment of the Company w.e.f. close of business hours of 9th September 2026 and Shri Tamal Pal has been designated as President-National Sales Head and as a Senior Management Personnel of the Company w.e.f. 10th September 2026.

Corporate Actions stock-summary

stock-summary
BOARD MEETING

No Upcoming Board Meetings

stock-summary
DIVIDEND

Birla Corporation Ltd has declared 125% dividend, ex-date: 24 Jul 26

stock-summary
SPLITS

No Splits history available

stock-summary
BONUS

No Bonus history available

stock-summary
RIGHTS

No Rights history available

stock-summaryKey Factors

Quality key factors stock-summary

Factor
Value
Sales Growth (5y)
6.13%
EBIT Growth (5y)
-3.20%
EBIT to Interest (avg)
2.27
Debt to EBITDA (avg)
3.54
Net Debt to Equity (avg)
0.30
Sales to Capital Employed (avg)
0.84
Tax Ratio
25.86%
Dividend Payout Ratio
26.08%
Pledged Shares
0
Institutional Holding
23.10%
ROCE (avg)
6.98%
ROE (avg)
5.22%

Valuation key factors

Factor
Value
P/E Ratio
11
Industry P/E
31
Price to Book Value
0.86
EV to EBIT
9.42
EV to EBITDA
5.89
EV to Capital Employed
0.89
EV to Sales
0.87
PEG Ratio
0.33
Dividend Yield
1.52%
ROCE (Latest)
9.65%
ROE (Latest)
7.59%

Technicals key factors

Indicator
Weekly
Monthly
MACD
Bearish
Bearish
RSI
No Signal
No Signal
Bollinger Bands
Bearish
Bearish
Moving Averages
Bearish (Daily)
KST
Bearish
Bearish
Dow Theory
Mildly Bearish
Mildly Bearish
OBV
Mildly Bearish
Mildly Bearish
stock-summary Technical Indicator Scale: Bearish, Mildly Bearish, Sideways, Mildly Bullish, Bullish  Turned 
stock-summaryShareholding
Shareholding Snapshot : Jun 2026stock-summary
Shareholding Compare (%holding) stock-summary
Majority shareholders

Promoters

Pledged Promoter Holdings

None

Mutual Funds

Held by 14 Schemes (14.82%)

FIIs

Held by 109 FIIs (6.13%)

Promoter with highest holding

Hindustan Medical Institution (9.3%)

Highest Public shareholder

Hdfc Mutual Fund (shares Held In Their Various Schemes) (4.3%)

Individual Investors Holdings

10.42%

stock-summaryFinancial
[
  {
    "link": "quarterly",
    "btn_text": "All Quarterly Results",
    "header": "Quarterly Results Snapshot (Consolidated) - Jun'26 - QoQ",
    "rhs": [
      {
        "prefix": "Net Sales ",
        "suffix": "QoQ Growth in quarter ended Jun 2026 is -6.69% vs 31.38% in Mar 2026",
        "dir": -1
      },
      {
        "prefix": "Consolidated Net Profit ",
        "suffix": "QoQ Growth in quarter ended Jun 2026 is -60.74% vs 458.72% in Mar 2026",
        "dir": -1
      }
    ],
    "table": {
      "header": [
        "Jun'26",
        "Mar'26",
        "Change(%)"
      ],
      "body": [
        {
          "field": "Net Sales",
          "val1": "2,646.45",
          "val2": "2,836.12",
          "chgp": "-6.69%",
          "chgp_class": "negative"
        },
        {
          "field": "Operating Profit (PBDIT) excl Other Income",
          "val1": "342.26",
          "val2": "510.27",
          "chgp": "-32.93%",
          "chgp_class": "negative"
        },
        {
          "field": "Interest",
          "val1": "67.22",
          "val2": "61.91",
          "chgp": "8.58%",
          "chgp_class": "negative"
        },
        {
          "field": "Exceptional Items",
          "val1": "0.00",
          "val2": "27.59",
          "chgp": "-100.00%",
          "chgp_class": "negative"
        },
        {
          "field": "Consolidate Net Profit",
          "val1": "115.73",
          "val2": "294.78",
          "chgp": "-60.74%",
          "chgp_class": "negative"
        },
        {
          "field": "Operating Profit Margin (Excl OI)",
          "val1": "12.93%",
          "val2": "17.99%",
          "chgp": "-5.06%",
          "chgp_class": "negative"
        }
      ]
    }
  },
  {
    "link": "half-yearly",
    "btn_text": "All Half Yearly Results",
    "header": "Half Yearly Results Snapshot (Consolidated) - Sep'25",
    "rhs": [
      {
        "prefix": "Net Sales ",
        "suffix": " Growth in half year ended Sep 2025 is 12.50% vs -11.75% in Sep 2024",
        "dir": 1
      },
      {
        "prefix": "Consolidated Net Profit ",
        "suffix": " Growth in half year ended Sep 2025 is 2,727.05% vs -93.71% in Sep 2024",
        "dir": 1
      }
    ],
    "table": {
      "header": [
        "Sep'25",
        "Sep'24",
        "Change(%)"
      ],
      "body": [
        {
          "field": "Net Sales",
          "val1": "4,660.75",
          "val2": "4,142.93",
          "chgp": "12.50%",
          "chgp_class": "positive"
        },
        {
          "field": "Operating Profit (PBDIT) excl Other Income",
          "val1": "651.61",
          "val2": "435.45",
          "chgp": "49.64%",
          "chgp_class": "positive"
        },
        {
          "field": "Interest",
          "val1": "137.25",
          "val2": "170.85",
          "chgp": "-19.67%",
          "chgp_class": "positive"
        },
        {
          "field": "Exceptional Items",
          "val1": "0.00",
          "val2": "0.00",
          "chgp": "",
          "chgp_class": "neutral"
        },
        {
          "field": "Consolidate Net Profit",
          "val1": "210.05",
          "val2": "7.43",
          "chgp": "2,727.05%",
          "chgp_class": "positive"
        },
        {
          "field": "Operating Profit Margin (Excl OI)",
          "val1": "13.98%",
          "val2": "10.51%",
          "chgp": "3.47%",
          "chgp_class": "positive"
        }
      ]
    }
  },
  {
    "link": "nine-monthly",
    "btn_text": "All Nine Monthly Results",
    "header": "Nine Monthly Results Snapshot (Consolidated) - Dec'25",
    "rhs": [
      {
        "prefix": "Net Sales ",
        "suffix": "YoY Growth in nine months ended Dec 2025 is 6.56% vs -8.64% in Dec 2024",
        "dir": 1
      },
      {
        "prefix": "Consolidated Net Profit ",
        "suffix": "YoY Growth in nine months ended Dec 2025 is 580.50% vs -83.00% in Dec 2024",
        "dir": 1
      }
    ],
    "table": {
      "header": [
        "Dec'25",
        "Dec'24",
        "Change(%)"
      ],
      "body": [
        {
          "field": "Net Sales",
          "val1": "6,819.49",
          "val2": "6,399.58",
          "chgp": "6.56%",
          "chgp_class": "positive"
        },
        {
          "field": "Operating Profit (PBDIT) excl Other Income",
          "val1": "944.17",
          "val2": "683.39",
          "chgp": "38.16%",
          "chgp_class": "positive"
        },
        {
          "field": "Interest",
          "val1": "202.58",
          "val2": "253.81",
          "chgp": "-20.18%",
          "chgp_class": "positive"
        },
        {
          "field": "Exceptional Items",
          "val1": "-34.14",
          "val2": "0.00",
          "chgp": "",
          "chgp_class": "neutral"
        },
        {
          "field": "Consolidate Net Profit",
          "val1": "262.81",
          "val2": "38.62",
          "chgp": "580.50%",
          "chgp_class": "positive"
        },
        {
          "field": "Operating Profit Margin (Excl OI)",
          "val1": "13.85%",
          "val2": "10.68%",
          "chgp": "3.17%",
          "chgp_class": "positive"
        }
      ]
    }
  },
  {
    "link": "annual",
    "btn_text": "All Annual Results",
    "header": "Annual Results Snapshot (Consolidated) - Mar'26",
    "rhs": [
      {
        "prefix": "Net Sales ",
        "suffix": "YoY Growth in year ended Mar 2026 is 4.79% vs -4.57% in Mar 2025",
        "dir": 1
      },
      {
        "prefix": "Consolidated Net Profit ",
        "suffix": "YoY Growth in year ended Mar 2026 is 88.87% vs -29.80% in Mar 2025",
        "dir": 1
      }
    ],
    "table": {
      "header": [
        "Mar'26",
        "Mar'25",
        "Change(%)"
      ],
      "body": [
        {
          "field": "Net Sales",
          "val1": "9,655.61",
          "val2": "9,214.49",
          "chgp": "4.79%",
          "chgp_class": "positive"
        },
        {
          "field": "Operating Profit (PBDIT) excl Other Income",
          "val1": "1,454.44",
          "val2": "1,217.22",
          "chgp": "19.49%",
          "chgp_class": "positive"
        },
        {
          "field": "Interest",
          "val1": "264.49",
          "val2": "327.06",
          "chgp": "-19.13%",
          "chgp_class": "positive"
        },
        {
          "field": "Exceptional Items",
          "val1": "-6.55",
          "val2": "-38.37",
          "chgp": "82.93%",
          "chgp_class": "positive"
        },
        {
          "field": "Consolidate Net Profit",
          "val1": "557.59",
          "val2": "295.23",
          "chgp": "88.87%",
          "chgp_class": "positive"
        },
        {
          "field": "Operating Profit Margin (Excl OI)",
          "val1": "15.06%",
          "val2": "13.21%",
          "chgp": "1.85%",
          "chgp_class": "positive"
        }
      ]
    }
  }
]

Quarterly Results Snapshot (Consolidated) - Jun'26 - QoQstock-summary

Jun'26
Mar'26
Change(%)
Net Sales
2,646.45
2,836.12
-6.69%
Operating Profit (PBDIT) excl Other Income
342.26
510.27
-32.93%
Interest
67.22
61.91
8.58%
Exceptional Items
0.00
27.59
-100.00%
Consolidate Net Profit
115.73
294.78
-60.74%
Operating Profit Margin (Excl OI)
12.93%
17.99%
-5.06%
Values in Rs Cr.
Direction Arrows
Net Sales

QoQ Growth in quarter ended Jun 2026 is -6.69% vs 31.38% in Mar 2026

Direction Arrows
Consolidated Net Profit

QoQ Growth in quarter ended Jun 2026 is -60.74% vs 458.72% in Mar 2026

Half Yearly Results Snapshot (Consolidated) - Sep'25stock-summary

Sep'25
Sep'24
Change(%)
Net Sales
4,660.75
4,142.93
12.50%
Operating Profit (PBDIT) excl Other Income
651.61
435.45
49.64%
Interest
137.25
170.85
-19.67%
Exceptional Items
0.00
0.00
Consolidate Net Profit
210.05
7.43
2,727.05%
Operating Profit Margin (Excl OI)
13.98%
10.51%
3.47%
Values in Rs Cr.
Direction Arrows
Net Sales

Growth in half year ended Sep 2025 is 12.50% vs -11.75% in Sep 2024

Direction Arrows
Consolidated Net Profit

Growth in half year ended Sep 2025 is 2,727.05% vs -93.71% in Sep 2024

Nine Monthly Results Snapshot (Consolidated) - Dec'25stock-summary

Dec'25
Dec'24
Change(%)
Net Sales
6,819.49
6,399.58
6.56%
Operating Profit (PBDIT) excl Other Income
944.17
683.39
38.16%
Interest
202.58
253.81
-20.18%
Exceptional Items
-34.14
0.00
Consolidate Net Profit
262.81
38.62
580.50%
Operating Profit Margin (Excl OI)
13.85%
10.68%
3.17%
Values in Rs Cr.
Direction Arrows
Net Sales

YoY Growth in nine months ended Dec 2025 is 6.56% vs -8.64% in Dec 2024

Direction Arrows
Consolidated Net Profit

YoY Growth in nine months ended Dec 2025 is 580.50% vs -83.00% in Dec 2024

Annual Results Snapshot (Consolidated) - Mar'26stock-summary

Mar'26
Mar'25
Change(%)
Net Sales
9,655.61
9,214.49
4.79%
Operating Profit (PBDIT) excl Other Income
1,454.44
1,217.22
19.49%
Interest
264.49
327.06
-19.13%
Exceptional Items
-6.55
-38.37
82.93%
Consolidate Net Profit
557.59
295.23
88.87%
Operating Profit Margin (Excl OI)
15.06%
13.21%
1.85%
Values in Rs Cr.
Direction Arrows
Net Sales

YoY Growth in year ended Mar 2026 is 4.79% vs -4.57% in Mar 2025

Direction Arrows
Consolidated Net Profit

YoY Growth in year ended Mar 2026 is 88.87% vs -29.80% in Mar 2025

stock-summaryCompany CV
About Birla Corporation Ltd stock-summary
stock-summary
Birla Corporation Ltd
Small Cap
Cement & Cement Products
Birla Corporation Limited (BCL), the flagship company of the M.P. Birla Group, is primarily engaged in the manufacturing of cement as its core business activity. It has significant presence in the jute industry as well. The Company was incorporated as Birla Jute Manufacturing Company Limited in year 1919.
Company Coordinates stock-summary
Company Details
Birla Building 3rd & 4th Floor, 9/1 R N Mukherjee Road Kolkata West Bengal : 700001
stock-summary
Tel: 91-033-66166726/6737/6738
stock-summary
investorsgrievance@birlacorp.com
Registrar Details
MCS Ltd , 3rd & 5th Floor, 77/2A Hazra Road, Kolkata