
Compare Birla Corpn. with Similar Stocks
Dashboard
Poor long term growth as Operating profit has grown by an annual rate -0.93% of over the last 5 years
Positive results in Mar 26
With ROCE of 9.7, it has a Very Attractive valuation with a 1 Enterprise value to Capital Employed
High Institutional Holdings at 22.99%
Consistent Underperformance against the benchmark over the last 3 years
Stock DNA
Cement & Cement Products
INR 7,863 Cr (Small Cap)
13.00
34
1.03%
0.30
7.59%
1.02
Total Returns (Price + Dividend) 
Latest dividend: 10 per share ex-dividend date: Sep-08-2025
Risk Adjusted Returns v/s
Returns Beta

News
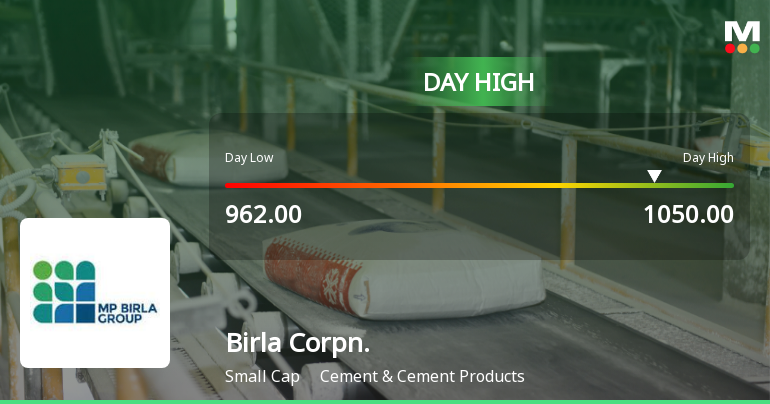
Birla Corporation Ltd Surges 7.1% to Day's High of Rs 1028 — Outperforms Sector by 5.14 Percentage Points
The Sensex rose 0.69% on 15 Jul 2026, yet Birla Corporation Ltd outpaced the broader market with a 7.1% gain, touching an intraday high of Rs 1028. This 5.14 percentage-point outperformance over its Cement & Cement Products sector peers signals a distinctly stock-specific rally rather than a market-wide lift.
Read full news article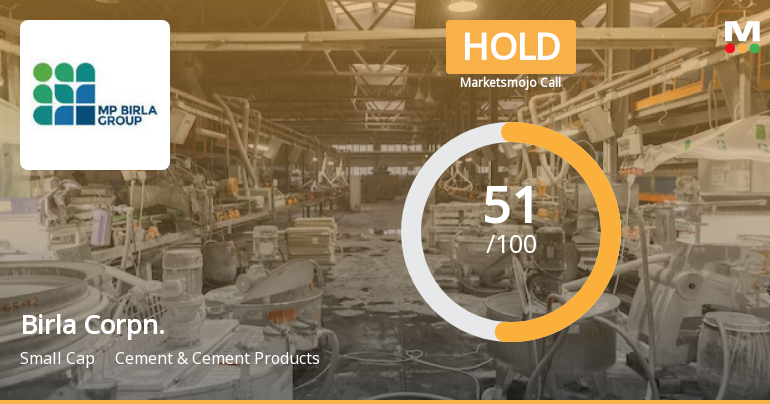
Birla Corporation Ltd is Rated Hold
Birla Corporation Ltd is rated 'Hold' by MarketsMOJO, with this rating last updated on 15 June 2026. However, the analysis and financial metrics presented here reflect the stock's current position as of 08 July 2026, providing investors with an up-to-date view of the company’s fundamentals, valuation, financial trends, and technical outlook.
Read full news article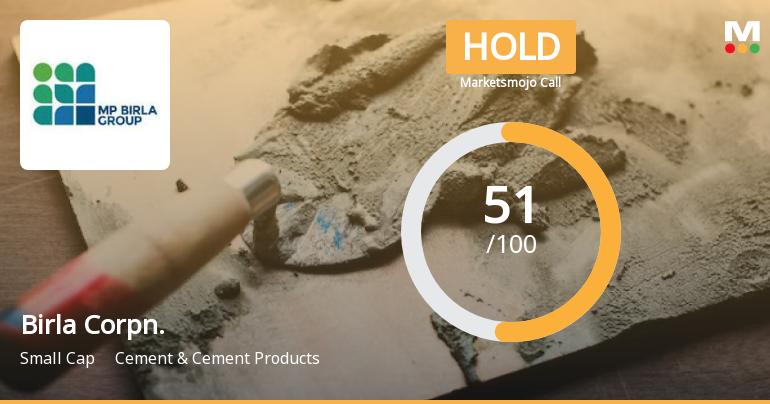
Birla Corporation Ltd is Rated Hold
Birla Corporation Ltd is rated 'Hold' by MarketsMOJO, with this rating last updated on 15 June 2026. While the rating was revised on that date, the analysis and financial metrics discussed here reflect the company’s current position as of 27 June 2026.
Read full news article Announcements
Announcement under Regulation 30 (LODR)-Newspaper Publication
10-Jul-2026 | Source : BSEPlease find enclosed the copies of newspaper publications made on 10th July 2026 regarding the Notice of the 106th Annual General Meeting of the Company Record Date and remote e-Voting information.
Announcement under Regulation 30 (LODR)-Credit Rating
10-Jul-2026 | Source : BSEIntimation of Credit Rating of RCCPL Private Limited Wholly-Owned Material Subsidiary of the Company.
Business Responsibility and Sustainability Reporting (BRSR)
09-Jul-2026 | Source : BSEPlease find enclosed the Business Responsibility and Sustainability Report for the Financial Year 2025-26.
Corporate Actions

No Upcoming Board Meetings

Birla Corporation Ltd has declared 125% dividend, ex-date: 24 Jul 26

No Splits history available

No Bonus history available

No Rights history available
Quality key factors
Valuation key factors
Technicals key factors
 Technical Indicator Scale: Bearish, Mildly Bearish, Sideways, Mildly Bullish, Bullish Turned
 Shareholding Snapshot : Mar 2026
Shareholding Compare (%holding)
Promoters
None
Held by 14 Schemes (14.55%)
Held by 112 FIIs (6.27%)
Hindustan Medical Institution (9.3%)
Hdfc Mutual Fund (shares Held In Their Various Schemes) (4.29%)
10.54%
Quarterly Results Snapshot (Consolidated) - Mar'26 - QoQ

QoQ Growth in quarter ended Mar 2026 is 31.38% vs -2.17% in Dec 2025
QoQ Growth in quarter ended Mar 2026 is 458.72% vs -41.69% in Dec 2025
Half Yearly Results Snapshot (Consolidated) - Sep'25
Growth in half year ended Sep 2025 is 12.50% vs -11.75% in Sep 2024
Growth in half year ended Sep 2025 is 2,727.05% vs -93.71% in Sep 2024
Nine Monthly Results Snapshot (Consolidated) - Dec'25
YoY Growth in nine months ended Dec 2025 is 6.56% vs -8.64% in Dec 2024
YoY Growth in nine months ended Dec 2025 is 580.50% vs -83.00% in Dec 2024
Annual Results Snapshot (Consolidated) - Mar'26
YoY Growth in year ended Mar 2026 is 4.79% vs -4.57% in Mar 2025
YoY Growth in year ended Mar 2026 is 88.87% vs -29.80% in Mar 2025
About Birla Corporation Ltd

Company Coordinates


