
Compare Birla Corpn. with Similar Stocks
Stock DNA
Cement & Cement Products
INR 7,192 Cr (Small Cap)
13.00
32
1.08%
0.30
7.59%
0.97
Total Returns (Price + Dividend) 
Latest dividend: 10 per share ex-dividend date: Sep-08-2025
Risk Adjusted Returns v/s
Returns Beta

News
Birla Corporation Ltd Downgraded to Sell Amid Mixed Financials and Bearish Technicals
Birla Corporation Ltd has seen its investment rating downgraded from Hold to Sell, reflecting a deterioration in technical indicators and persistent long-term underperformance despite recent positive quarterly financial results. The downgrade, effective from 09 June 2026, is driven primarily by a shift in technical trends, subdued financial growth over the past five years, and valuation concerns relative to its peers in the cement sector.
Read full news article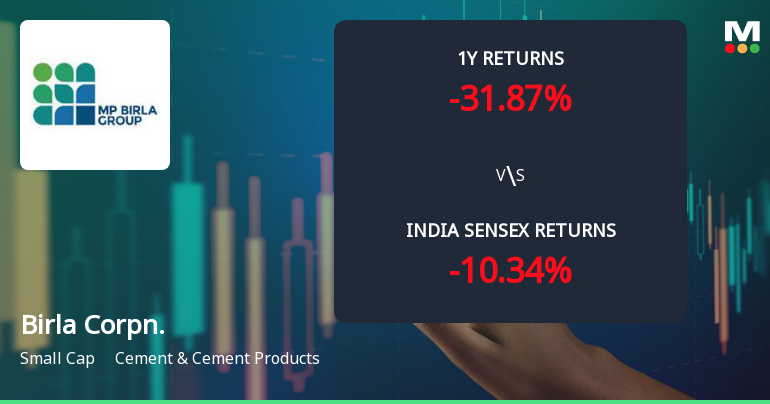
Birla Corporation Ltd Faces Bearish Momentum Amid Technical Downgrade
Birla Corporation Ltd has experienced a notable shift in its technical momentum, with key indicators signalling a transition from mildly bearish to bearish territory. The company’s recent downgrade from a Hold to a Sell rating by MarketsMOJO reflects growing concerns over its price momentum and technical health amid a challenging market backdrop.
Read full news article
Birla Corporation Ltd is Rated Hold
Birla Corporation Ltd is rated 'Hold' by MarketsMOJO, with this rating last updated on 09 May 2026. While the rating change occurred on that date, the analysis and financial metrics presented here reflect the stock's current position as of 08 June 2026, providing investors with the most up-to-date view of the company’s fundamentals, returns, and market standing.
Read full news article Announcements
Announcement under Regulation 30 (LODR)-Newspaper Publication
27-May-2026 | Source : BSEPlease find enclosed herewith copies of Newspaper Advertisement published on 27th May 2026 regarding Notice intimating the shareholders about the launch of second 100 days Campaign Saksham Niveshak.
Announcement under Regulation 30 (LODR)-Earnings Call Transcript
14-May-2026 | Source : BSEPlease find attached the transcript of the investors/analyst conference call held on 11th May 2026 at 12:00 noon (IST) on the Annual Audited Standalone and Consolidated Financial Results of the Company for the quarter and year ended 31st March 2026.
Compliances-Reg.24(A)-Annual Secretarial Compliance
14-May-2026 | Source : BSEPlease find attached the Annual Secretarial Compliance Report of the Company for the financial year ended 31st March 2026 issued by M/s. Mamta Binani & Associates.
Corporate Actions

No Upcoming Board Meetings

Birla Corporation Ltd has declared 100% dividend, ex-date: 08 Sep 25

No Splits history available

No Bonus history available

No Rights history available
Quality key factors
Valuation key factors
Technicals key factors
 Technical Indicator Scale: Bearish, Mildly Bearish, Sideways, Mildly Bullish, Bullish Turned
 Shareholding Snapshot : Mar 2026
Shareholding Compare (%holding)
Promoters
None
Held by 14 Schemes (14.55%)
Held by 112 FIIs (6.27%)
Hindustan Medical Institution (9.3%)
Hdfc Mutual Fund (shares Held In Their Various Schemes) (4.29%)
10.54%
Quarterly Results Snapshot (Consolidated) - Mar'26 - QoQ

QoQ Growth in quarter ended Mar 2026 is 31.38% vs -2.17% in Dec 2025
QoQ Growth in quarter ended Mar 2026 is 458.72% vs -41.69% in Dec 2025
Half Yearly Results Snapshot (Consolidated) - Sep'25
Growth in half year ended Sep 2025 is 12.50% vs -11.75% in Sep 2024
Growth in half year ended Sep 2025 is 2,727.05% vs -93.71% in Sep 2024
Nine Monthly Results Snapshot (Consolidated) - Dec'25
YoY Growth in nine months ended Dec 2025 is 6.56% vs -8.64% in Dec 2024
YoY Growth in nine months ended Dec 2025 is 580.50% vs -83.00% in Dec 2024
Annual Results Snapshot (Consolidated) - Mar'26
YoY Growth in year ended Mar 2026 is 4.79% vs -4.57% in Mar 2025
YoY Growth in year ended Mar 2026 is 88.87% vs -29.80% in Mar 2025
About Birla Corporation Ltd

Company Coordinates


