
Compare Black Rose Indus with Similar Stocks
Dashboard
The company is Net-Debt Free
Poor long term growth as Net Sales has grown by an annual rate of -3.19% and Operating profit at -5.06% over the last 5 years
The company has declared positive results in Mar'2026 after 3 consecutive negative quarters
With ROE of 13.3, it has a Very Expensive valuation with a 3.3 Price to Book Value
Despite the size of the company, domestic mutual funds hold only 0.01% of the company
Market Beating Performance
Stock DNA
Specialty Chemicals
INR 644 Cr (Micro Cap)
25.00
25
0.58%
-0.17
13.27%
3.35
Total Returns (Price + Dividend) 
Latest dividend: 0.1 per share ex-dividend date: Sep-22-2025
Risk Adjusted Returns v/s
Returns Beta

News

Black Rose Industries Ltd Upgraded to Hold by MarketsMOJO on Improved Technicals and Financials
Black Rose Industries Ltd, a micro-cap player in the Specialty Chemicals sector, has seen its investment rating upgraded from Sell to Hold as of 22 June 2026. This change reflects a combination of improved technical indicators, positive quarterly financial results, and a nuanced valuation assessment, signalling a cautious but optimistic outlook for investors.
Read full news article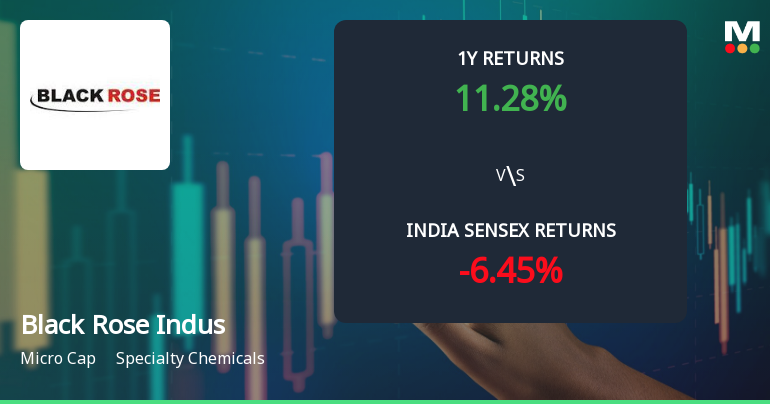
Black Rose Industries Ltd Sees Technical Momentum Shift Amid Strong Price Rally
Black Rose Industries Ltd, a micro-cap player in the specialty chemicals sector, has witnessed a notable shift in its technical momentum, signalling a transition from a mildly bearish to a mildly bullish trend. This change is underscored by a robust price surge of 15.48% in a single day, reflecting renewed investor interest and improving market sentiment.
Read full news article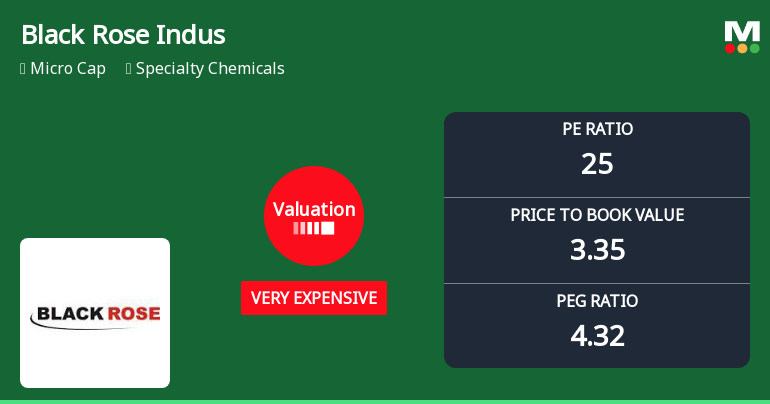
Black Rose Industries Ltd Valuation Shifts Signal Price Attractiveness Change
Black Rose Industries Ltd, a micro-cap player in the Specialty Chemicals sector, has witnessed a notable shift in its valuation parameters, moving from an expensive to a very expensive rating. This change, coupled with a robust 15.48% surge in its share price on 23 June 2026, invites a closer examination of its price-to-earnings (P/E) and price-to-book value (P/BV) ratios relative to historical trends and peer benchmarks.
Read full news article Announcements
Compliances-Reg.24(A)-Annual Secretarial Compliance
30-May-2026 | Source : BSEAnnual Secretarial Compliance Report as on 31st March 2026
Announcement under Regulation 30 (LODR)-Earnings Call Transcript
28-May-2026 | Source : BSEAnnouncement under Regulation 30 (LODR) - Earnings Call Transcript.
Announcement under Regulation 30 (LODR)-Analyst / Investor Meet - Outcome
22-May-2026 | Source : BSEOutcome of Earnings Webinar for FY26
Corporate Actions

No Upcoming Board Meetings

Black Rose Industries Ltd has declared 55% dividend, ex-date: 22 Sep 25

No Splits history available

Black Rose Industries Ltd has announced 1:1 bonus issue, ex-date: 30 Jun 11

No Rights history available
Quality key factors
Valuation key factors
Technicals key factors
 Technical Indicator Scale: Bearish, Mildly Bearish, Sideways, Mildly Bullish, Bullish Turned
 Shareholding Snapshot : Mar 2026
Shareholding Compare (%holding)
Promoters
None
Held by 1 Schemes (0.0%)
Held by 0 FIIs
Wedgewood Holdings Limited (56.47%)
Bhanwarilal Panda (1.46%)
18.71%
Quarterly Results Snapshot (Consolidated) - Mar'26 - YoY

YoY Growth in quarter ended Mar 2026 is 25.52% vs -28.15% in Mar 2025
YoY Growth in quarter ended Mar 2026 is 61.96% vs 1.93% in Mar 2025
Half Yearly Results Snapshot (Consolidated) - Sep'25

Growth in half year ended Sep 2025 is -13.99% vs -2.48% in Sep 2024
Growth in half year ended Sep 2025 is -8.59% vs -6.63% in Sep 2024
Nine Monthly Results Snapshot (Consolidated) - Dec'25
YoY Growth in nine months ended Dec 2025 is -14.10% vs -3.84% in Dec 2024
YoY Growth in nine months ended Dec 2025 is -13.95% vs -2.64% in Dec 2024
Annual Results Snapshot (Consolidated) - Mar'26
YoY Growth in year ended Mar 2026 is -4.25% vs -11.32% in Mar 2025
YoY Growth in year ended Mar 2026 is 7.07% vs -1.37% in Mar 2025
About Black Rose Industries Ltd

Company Coordinates


