
Compare Bloom Dekor with Similar Stocks
Dashboard
With a Negative Book Value, the company has a Weak Long Term Fundamental Strength
- Poor long term growth as Net Sales has grown by an annual rate of -30.27% and Operating profit at 0% over the last 5 years
- The company has a negative book value of Rs 7.45 crore
Flat results in Mar 26
Risky - Negative EBITDA
Below par performance in long term as well as near term
Stock DNA
Plastic Products - Industrial
INR 6 Cr (Micro Cap)
NA (Loss Making)
32
0.00%
-1.60
11.81%
-0.83
Total Returns (Price + Dividend) 
Latest dividend: 0.6 per share ex-dividend date: Jul-30-2015
Risk Adjusted Returns v/s
Returns Beta

News
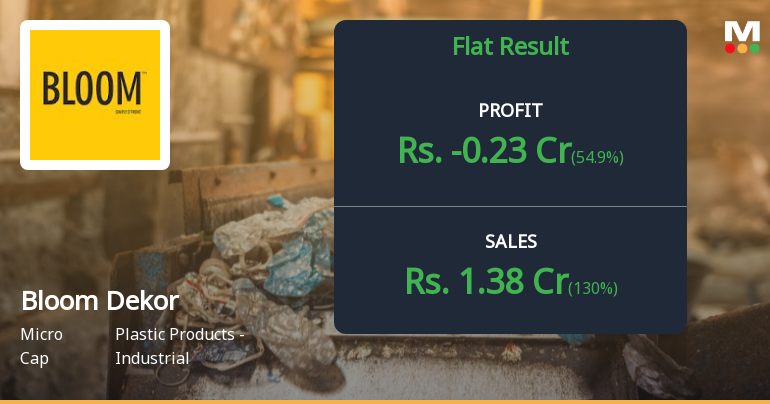
Bloom Dekor Q4 FY26: Mounting Losses Deepen as Revenue Recovery Fails to Stem Profitability Crisis
Bloom Dekor Ltd., the Ahmedabad-based high-pressure decorative laminates manufacturer, reported a net loss of ₹0.23 crores for Q4 FY26 (Jan-Mar'26), marking the seventh consecutive quarter of losses despite a sharp 130.00% quarter-on-quarter revenue surge. The micro-cap company, valued at just ₹6.00 crores, continues to grapple with deeply negative operating margins and structural profitability challenges that have eroded shareholder value by 25.40% over the past year.
Read full news article
Announcements
Corporate Insolvency Resolution Process (CIRP)-Approval of Resolution plan by Tribunal
19-Jun-2026 | Source : BSEWe wish to inform that the Honable National Company Law Tribunal Ahmedabad Bench has vide its Order pronounced on June 18 2026 in IA (Plan) 8 (AHM) of 2026 in CP IB 127 (AHM) of 2020 approved the Resolution Plan submitted by Resolution Applicant.
Board Meeting Outcome for Audited Financial Results For The Quarter And Year Ended On March 31 2026
25-May-2026 | Source : BSEAudited financial results for the quarter and year ended on March 31 2026
Audited Financial Results For The Quarter And Year Ended On March 31 2026
25-May-2026 | Source : BSEWe submitting herewith audited financial results for the quarter and year ended on March 31 2026
Corporate Actions

No Upcoming Board Meetings

Bloom Dekor Ltd has declared 6% dividend, ex-date: 30 Jul 15

No Splits history available

No Bonus history available

No Rights history available
Quality key factors
Valuation key factors
Technicals key factors
 Technical Indicator Scale: Bearish, Mildly Bearish, Sideways, Mildly Bullish, Bullish Turned
 Shareholding Snapshot : Mar 2026
Shareholding Compare (%holding)
Promoters
None
Held by 0 Schemes
Held by 0 FIIs
Sunil Sitaram Gupta (31.96%)
Bimalkumar P Brahmbhatt (11.96%)
18.1%
Quarterly Results Snapshot (Standalone) - Mar'26 - QoQ

QoQ Growth in quarter ended Mar 2026 is 130.00% vs -46.43% in Dec 2025
QoQ Growth in quarter ended Mar 2026 is 54.90% vs -183.33% in Dec 2025
Half Yearly Results Snapshot (Standalone) - Sep'25
Growth in half year ended Sep 2025 is 20.00% vs -23.63% in Sep 2024
Growth in half year ended Sep 2025 is 61.11% vs 23.40% in Sep 2024
Nine Monthly Results Snapshot (Standalone) - Dec'25
YoY Growth in nine months ended Dec 2025 is 8.31% vs -28.04% in Dec 2024

YoY Growth in nine months ended Dec 2025 is 4.41% vs 17.07% in Dec 2024
Annual Results Snapshot (Standalone) - Mar'26
YoY Growth in year ended Mar 2026 is 14.16% vs -21.12% in Mar 2025
YoY Growth in year ended Mar 2026 is 14.56% vs -21.18% in Mar 2025
About Bloom Dekor Ltd

Company Coordinates


