Blue Cloud Soft.

  • Market Cap: Micro Cap
  • Industry: Software Products
  • ISIN: INE373T01047
  • NSEID: BLUECLOUDS
  • BSEID: 539607
INR
22.36
-0.65 (-2.82%)
BSENSE

Aug 25, 03:30 PM

BSE+NSE Vol: 7.18 lacs

  • Price Points
  • Score
  • Mojo Parameters
  • Total Return
  • News and Corporate Actions
  • Key factors
  • Shareholding
  • Financials
  • CompanyCV
stock-summaryPrice Point
High/Low

1Day

52 Week

Valuation
Technical
Day's Volume

CASH

7.18 lacs (13.69%) Volume

Shareholding (Jun 2026)

FII

13.28%

Held by 100025000 FIIs

DII

0.00%

Held by 0 DIIs

Promoter

38.44%

Why is Blue Cloud Softech Solutions Ltd falling/rising?

25-Aug-2026

As of 24-Aug, Blue Cloud Softech Solutions Ltd's stock price has risen to 23.01, reflecting a 4.07% increase due to strong operational performance and positive market sentiment, despite concerns over reduced investor participation and a decline in stock returns. The company shows healthy long-term growth with significant increases in net sales and operating profit.

As of 24-Aug, Blue Cloud Softech Solutions Ltd is experiencing a rise in its stock price, currently at 23.01, reflecting an increase of 0.9 or 4.07%. This upward movement can be attributed to several positive factors. The stock has outperformed the sector by 4% today and is trading above its 5-day, 20-day, 50-day, 100-day, and 200-day moving averages, indicating strong short-term momentum.<BR><BR>Moreover, the company has demonstrated healthy long-term growth, with net sales increasing at an annual rate of 41.20% and operating profit rising by 93.14%. The positive results over the last 14 consecutive quarters, including a PAT growth of 32.07% and record net sales of Rs 292.52 cr, further bolster investor confidence. Despite a year-over-year decline of 25.46% in stock returns, the company's profits have increased by 37%, suggesting a disconnect between stock performance and underlying financial health.<BR><BR>However, it is important to note that there are concerns regarding investor participation, as delivery volume has fallen significantly, indicating reduced trading interest. Additionally, the lack of domestic mutual fund investment may signal caution among institutional investors. Despite these factors, the current rise in stock price appears to be driven by strong operational performance and positive market sentiment.

View full answer

Should I buy, sell or hold Blue Cloud Softech Solutions Ltd?

18-Aug-2026

Who are in the management team of Blue Cloud Soft.?

14-Aug-2026

The management team of Blue Cloud Soft includes Bogha Kumar Ravi (Managing Director), Ganapathi Raju Mani and G N Sharma (Non-Executive & Independent Directors), Shraya Jaiswal (Company Secretary), Manoj Sandilya Telakapalli (Whole Time Director & CFO), Siva Prasad Gorthy (Additional Director), Mayank Puran Chandra Joshi (Managing Director & Additional Director), and Janaki Yarlagadda (Whole Time Director & Additional Director).

The management team of Blue Cloud Soft includes the following individuals:<BR><BR>1. **Bogha Kumar Ravi** - Managing Director<BR>2. **Ganapathi Raju Mani** - Non-Executive & Independent Director<BR>3. **G N Sharma** - Non-Executive & Independent Director<BR>4. **Shraya Jaiswal** - Company Secretary & Compliance Officer<BR>5. **Manoj Sandilya Telakapalli** - Whole Time Director & CFO<BR>6. **Siva Prasad Gorthy** - Additional Director<BR>7. **Mayank Puran Chandra Joshi** - Managing Director & Additional Director<BR>8. **Janaki Yarlagadda** - Whole Time Director & Additional Director<BR><BR>If you have any more questions about the company or its management, feel free to ask!

View full answer

What does Blue Cloud Soft. do?

14-Aug-2026

Blue Cloud Softech Solutions Ltd is a micro-cap software company based in Hyderabad, incorporated in 1991, with recent quarterly net sales of 278 Cr and net profit of 12 Cr as of March 2026. Key metrics include a market cap of INR 2,075 Cr, P/E of 34.00, and a debt-equity ratio of 0.29.

Overview:<BR>Blue Cloud Softech Solutions Ltd operates in the software products industry and is categorized as a micro-cap company.<BR><BR>History:<BR>The company was incorporated on August 28th, 1991, originally as a Private Limited Company in Hyderabad, and was later converted into a Public Limited Company on April 4th, 1994. The latest quarterly results reported net sales and net profit for the period ending March 2026.<BR><BR>Financial Snapshot:<BR>Net Sales: 278 Cr (Quarterly Results - Mar 2026) <BR>Net Profit: 12 Cr (Quarterly Results - Mar 2026) <BR>Market Cap: INR 2,075 Cr (Micro Cap)<BR><BR>Key Metrics:<BR>P/E: 34.00 <BR>Industry P/E: 22 <BR>Dividend Yield: 0.00% <BR>Debt-Equity: 0.29 <BR>Return on Equity: 6.55% <BR>Price to Book: 2.28 <BR><BR>Contact Details:<BR>Address: 1-2-286, Domalguda Hyderabad Telangana : 500029 <BR>Email: csadithyaaquaculture@gmail.com <BR>Website: http://www.adithyaaquaculture.com

View full answer

Who are the peers of the Blue Cloud Soft.?

14-Aug-2026

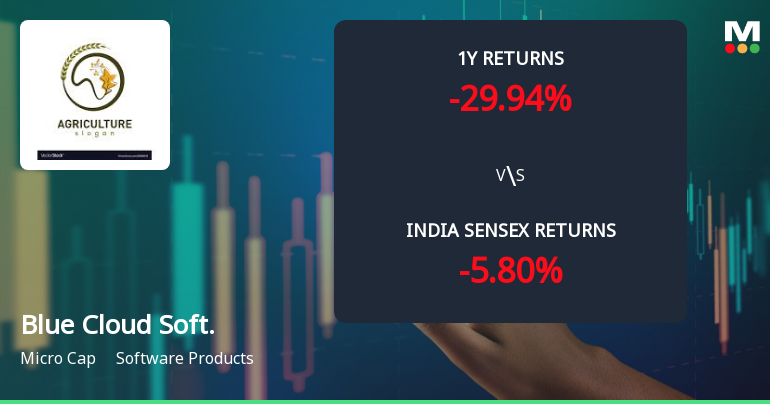
Peers of Blue Cloud Soft. include Tanla Platforms, C.E. Info System, Moschip Tech., Technvision Ven., Ramco Systems, Nucleus Soft., Unicommerce, Quick Heal Tech, and Subex. Blue Cloud Soft. has average management risk, below average growth, and a 1-year return of -26.59%.

Peers: The peers of Blue Cloud Soft. are Tanla Platforms, C.E. Info System, Moschip Tech., Technvision Ven., Ramco Systems, Nucleus Soft., Unicommerce, Quick Heal Tech, and Subex.<BR><BR>Quality Snapshot: Excellent management risk is observed at C.E. Info System and Nucleus Soft., while Good management risk is found at Unicommerce. Average management risk is present at Tanla Platforms, Technvision Ven., Quick Heal Tech, Subex, and Blue Cloud Soft., while Below Average management risk is noted at Moschip Tech. and Ramco Systems. Growth is Excellent at Blue Cloud Soft., Unicommerce, and Moschip Tech., while Below Average growth is seen at Tanla Platforms, C.E. Info System, Technvision Ven., Ramco Systems, Nucleus Soft., Quick Heal Tech, Subex, and the rest. Capital Structure is Excellent at Tanla Platforms, C.E. Info System, Nucleus Soft., and the rest, while Average capital structure is found at Blue Cloud Soft. and Good at Moschip Tech., Quick Heal Tech, and Subex.<BR><BR>Return Snapshot: The peer with the highest 1-year return is Moschip Tech. at 24.83%, while the lowest is C.E. Info System at -44.01%. Blue Cloud Soft.'s 1-year return is -26.59%, which is higher than C.E. Info System but lower than Moschip Tech. Additionally, the six-month return is negative for Tanla Platforms, C.E. Info System, Ramco Systems, Nucleus Soft., Unicommerce, Quick Heal Tech, and IRIS Regtech Sol.

View full answer

How big is Blue Cloud Soft.?

14-Aug-2026

As of 14th August, Blue Cloud Softech Solutions Ltd has a market capitalization of 2,092.63 Cr and reported net sales of 1,001.90 Cr and net profit of 60.50 Cr over the latest four quarters.

As of 14th August, <BR><BR>Market Cap: Blue Cloud Softech Solutions Ltd has a market capitalization of 2,092.63 Cr, classified as a Micro Cap.<BR><BR>Recent Quarterly Performance: The sum of Net Sales for the latest 4 quarters is 1,001.90 Cr, while the sum of Net Profit for the same period is 60.50 Cr.<BR><BR>Balance Sheet Snapshot: The reporting period for the balance sheet is March 2025. Shareholder's Funds are valued at 121.80 Cr, and Total Assets amount to 350.70 Cr.

View full answer

Are Blue Cloud Softech Solutions Ltd latest results good or bad?

01-Jun-2026

Blue Cloud Softech Solutions Ltd reported strong revenue growth of 51.14% in Q4 FY26, with net sales reaching ₹277.52 crores. However, net profit fell 34.82% due to increased depreciation and tax rates, raising concerns about profitability and cash flow, suggesting investors should proceed with caution.

The latest results for Blue Cloud Softech Solutions Ltd indicate a mixed performance. On one hand, the company achieved significant revenue growth, with net sales reaching ₹277.52 crores in Q4 FY26, reflecting a year-on-year increase of 51.14%. This marks a strong performance in terms of top-line growth, showcasing the company's ability to capture market share in the competitive software products sector.<BR><BR>However, the net profit for the same quarter fell sharply to ₹12.11 crores, representing a 34.82% decline from the previous quarter. This decline in profitability raises concerns, especially given the substantial increase in depreciation expenses and a significantly higher tax rate, which contributed to the reduced net profit margins.<BR><BR>While the operating margin improved to 17.23%, the overall picture is clouded by the volatility in profitability. The company has demonstrated strong return on equity (ROE) of 33.12%, indicating effective capital management, but the recent profit decline and negative operating cash flow suggest operational challenges that need to be addressed.<BR><BR>In summary, while Blue Cloud Softech is experiencing robust revenue growth, the deterioration in profitability and cash flow presents a concerning outlook. Investors should be cautious and monitor the company's upcoming results to assess whether these issues are temporary or indicative of deeper operational problems.

View full answer

When is the next results date for Blue Cloud Softech Solutions Ltd?

26-May-2026

The next results date for Blue Cloud Softech Solutions Ltd is 30 May 2026.

The next results date for Blue Cloud Softech Solutions Ltd is scheduled for 30 May 2026.

View full answer

Is Blue Cloud Soft. technically bullish or bearish?

18-Nov-2025

As of November 17, 2025, Blue Cloud Soft's technical trend is mildly bearish, with mixed signals from indicators like the MACD and RSI, while bearish Bollinger Bands and a bearish KST suggest a cautious approach.

As of 17 November 2025, the technical trend for Blue Cloud Soft has changed from sideways to mildly bearish. The current technical stance is mildly bearish, driven by several key indicators. The weekly MACD is mildly bullish, but the monthly MACD is bearish, indicating mixed signals. The RSI shows no signal on the weekly timeframe but is bullish on the monthly, suggesting potential upward momentum in the longer term. However, both the weekly and monthly Bollinger Bands are bearish, reinforcing the negative outlook. Daily moving averages are mildly bullish, providing some short-term support. Dow Theory indicates a mildly bearish stance on the weekly and mildly bullish on the monthly, further complicating the overall picture. The KST is bearish on both timeframes, adding to the bearish sentiment. Overall, the combination of these indicators suggests a cautious approach, with the bearish signals outweighing the bullish ones.

View full answer

How has been the historical performance of Blue Cloud Soft.?

17-Nov-2025

Blue Cloud Soft experienced significant growth from March 2024 to March 2025, with net sales increasing to 796.86 Cr from 502.19 Cr, and profit after tax rising to 44.27 Cr from 16.08 Cr. Key metrics such as operating profit margin and earnings per share also improved notably during this period.

Answer:<BR>The historical performance of Blue Cloud Soft shows significant growth from March 2024 to March 2025.<BR><BR>Breakdown:<BR>In the fiscal year ending March 2025, Blue Cloud Soft reported net sales of 796.86 Cr, a substantial increase from 502.19 Cr in the previous year. Total operating income mirrored this growth, reaching 796.86 Cr, while total expenditure rose to 726.65 Cr from 475.60 Cr. Operating profit (PBDIT) also improved significantly, rising to 71.06 Cr from 26.89 Cr, resulting in an operating profit margin of 8.81%, up from 5.29%. Profit before tax increased to 59.13 Cr from 21.76 Cr, leading to a profit after tax of 44.27 Cr, compared to 16.08 Cr in the prior year. The earnings per share (EPS) surged to 2.03 from 0.37. On the balance sheet, total assets grew to 350.70 Cr from 193.16 Cr, while total liabilities increased to 350.70 Cr from 193.16 Cr, reflecting a rise in long-term borrowings. Cash flow from operating activities showed a slight improvement, with a cash outflow of 12.00 Cr compared to 19.00 Cr the previous year. Overall, Blue Cloud Soft demonstrated strong financial performance and growth across multiple metrics.

View full answer

Is Blue Cloud Soft. overvalued or undervalued?

14-Nov-2025

As of November 13, 2025, Blue Cloud Soft. is fairly valued with a PE Ratio of 23.01, an EV to EBITDA of 16.66, and a PEG Ratio of 0.62, indicating competitive positioning despite a year-to-date stock performance decline of -71.95%.

As of 13 November 2025, the valuation grade for Blue Cloud Soft. has moved from very attractive to fair. The company is currently fairly valued based on its financial metrics. Key ratios include a PE Ratio of 23.01, an EV to EBITDA of 16.66, and a PEG Ratio of 0.62, which suggests growth potential relative to its price.<BR><BR>In comparison to its peers, Blue Cloud Soft. has a PE Ratio that is slightly higher than TCS at 22.34 and lower than HCL Technologies at 25.54, indicating a competitive position within the industry. While the company's recent stock performance has been poor, with a year-to-date return of -71.95% compared to the Sensex's 8.11%, the valuation suggests that it is not significantly overvalued at this time.

View full answer

Who are the top shareholders of the Blue Cloud Soft.?

17-Jul-2025

The top shareholders of Blue Cloud Soft are Yarlagadda Janaki with 33.37%, Blue Sky Capital Fund Spc with 22.93%, and two foreign institutional investors holding 22.94%. Individual investors own 7.79%, with no pledged promoter holdings or mutual fund involvement.

The top shareholders of Blue Cloud Soft include Yarlagadda Janaki, who holds the highest promoter stake at 33.37%. Additionally, Blue Sky Capital Fund Spc is the largest public shareholder with a holding of 22.93%. The company also has 22.94% of its shares held by two foreign institutional investors (FIIs), while individual investors collectively hold 7.79%. There are no pledged promoter holdings, and no mutual funds are involved with the company.

View full answer

Has Blue Cloud Soft. declared dividend?

06-Jun-2025

Blue Cloud Softech Solutions Ltd has declared a 1% dividend, amounting to 0.02 per share, with an ex-date of October 11, 2024. Despite the dividend declaration, the company has experienced significant declines in total returns over various periods, particularly in the last six months and year.

Blue Cloud Softech Solutions Ltd has declared a 1% dividend.<BR><BR>Dividend Details:<BR>- Percentage announced: 1%<BR>- Amount per share: 0.02<BR>- Ex-date: 11 Oct 2024<BR><BR>Dividend Yield: 0.04%.<BR><BR>Total Returns by Period:<BR>In the last 6 months, the price return was -81.71%, with a dividend return of 0%, resulting in a total return of -81.71%.<BR><BR>Over the past year, the price return was -77.31%, the dividend return was 0.02%, leading to a total return of -77.29%.<BR><BR>In the 2-year period, the price return was -62.04%, with a dividend return of 0.03%, culminating in a total return of -62.01%.<BR><BR>For the 3-year period, the price return was 46.35%, the dividend return was 0.17%, resulting in a total return of 46.52%.<BR><BR>Over the last 4 years, there was no price return or dividend return, leading to a total return of 0.0%.<BR><BR>In the 5-year period, there was also no price return or dividend return, resulting in a total return of 0.0%.<BR><BR>Overall, while Blue Cloud Softech Solutions Ltd has declared a dividend, the total returns over various periods show significant declines, particularly in the shorter terms, indicating challenges in the company's performance.

View full answer
iScoreScore
Click here to find our call on this stock
Strong Sell
Sell
Hold
Buy
Strong Buy

Dashboard

1

Healthy long term growth as Net Sales has grown by an annual rate of 41.20% and Operating profit at 93.14%

 
2

The company has declared Positive results for the last 14 consecutive quarters

3

With ROCE of 8.3, it has a Fair valuation with a 2 Enterprise value to Capital Employed

4

Despite the size of the company, domestic mutual funds hold only 0% of the company

5

Underperformed the market in the last 1 year

stock-summaryMojo Parameters

Mojo Parameters

Loading Valuation Snapshot...

Stock DNA

stock-summary
Industry

Software Products

stock-summary
Market cap

INR 2,116 Cr (Micro Cap)

stock-summary
P/E

32.00

stock-summary
Industry P/E

21

stock-summary
Dividend Yield

0.00%

stock-summary
Debt Equity

0.29

stock-summary
Return on Equity

6.55%

stock-summary
Price to Book

2.30

Revenue and Profits:
Net Sales:
293 Cr
(Quarterly Results - Jun 2026)
Net Profit:
18 Cr
stock-summaryTotal Returns
Total Returns (Price + Dividend) stock-summary
Dividend Yield (0%)
TimePeriod
Price Return
Dividend Return
Total Return
3 Months
19.13%
0%
19.13%
6 Months
10.58%
0%
10.58%
1 Year
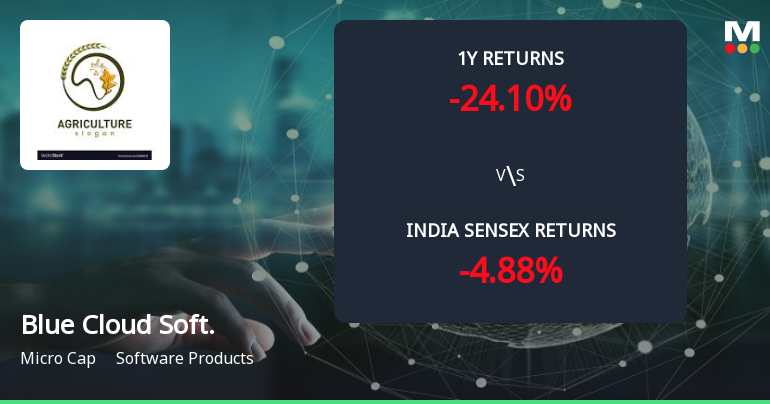
-24.1%
0%
-24.1%
2 Years
-80.01%
0.01%
-80.0%
3 Years
-41.19%
0.03%
-41.16%
4 Years
254.92%
0.13%
255.05%
5 Years
288.87%
0.20%
289.07%

Latest dividend: 0.01 per share ex-dividend date: Oct-11-2024

Risk Adjusted Returns v/s stock-summary
Returns Beta
Icon
Beta has not been calculated since enough price history is not available
stock-summaryNews & Corporate Actions

Announcements stock-summary

Announcement under Regulation 30 (LODR)-Press Release / Media Release

20-Aug-2026 | Source : BSE

Blue Cloud Softech Solutions Signs Strategic Memorandum of Agreement with GCIB for Africa and Afro Mobile SARL for Telecommunications and Digital Infrastructure Development Across Africa"

Blue Cloud Softech Solutions Signs Strategic Memorandum Of Agreement With GCIB For Africa And Afro Mobile SARL For Telecommunications And Digital Infrastructure Development Across Africa"

20-Aug-2026 | Source : BSE

Blue Cloud Softech Solutions Signs Strategic Memorandum of Agreement with GCIB for Africa and Afro Mobile SARL for Telecommunications and Digital Infrastructure Development Across Africa"

Intimation Under Regulation 30 Of The SEBI (Listing Obligations And Disclosure Requirements) Regulations 2015: Press Release On Listing Of Equity Shares Of The Company On The National Stock Exchange Of India Limited

18-Aug-2026 | Source : BSE

Intimation under Regulation 30 of the SEBI (Listing Obligations and Disclosure Requirements) Regulations 2015: Press Release on listing of equity shares of the Company on the National Stock Exchange of India Limited

Corporate Actions stock-summary

stock-summary
BOARD MEETING

No Upcoming Board Meetings

stock-summary
DIVIDEND

Blue Cloud Softech Solutions Ltd has declared 1% dividend, ex-date: 11 Oct 24

stock-summary
SPLITS

Blue Cloud Softech Solutions Ltd has announced 1:2 stock split, ex-date: 20 Jan 25

stock-summary
BONUS

No Bonus history available

stock-summary
RIGHTS

No Rights history available

stock-summaryKey Factors

Quality key factors stock-summary

Factor
Value
Sales Growth (5y)
41.20%
EBIT Growth (5y)
93.14%
EBIT to Interest (avg)
9.45
Debt to EBITDA (avg)
1.86
Net Debt to Equity (avg)
0.29
Sales to Capital Employed (avg)
2.86
Tax Ratio
31.76%
Dividend Payout Ratio
0
Pledged Shares
0
Institutional Holding
13.28%
ROCE (avg)
20.46%
ROE (avg)
21.45%

Valuation key factors

Factor
Value
P/E Ratio
32
Industry P/E
21
Price to Book Value
2.24
EV to EBIT
21.67
EV to EBITDA
14.22
EV to Capital Employed
1.96
EV to Sales
2.14
PEG Ratio
NA
Dividend Yield
NA
ROCE (Latest)
8.32%
ROE (Latest)
6.55%

Technicals key factors

Indicator
Weekly
Monthly
MACD
Bullish
Bearish
RSI
No Signal
Bullish
Bollinger Bands
Bullish
Mildly Bearish
Moving Averages
Bullish (Daily)
KST
Bullish
Bearish
Dow Theory
Mildly Bearish
Mildly Bearish
OBV
No Trend
No Trend
stock-summary Technical Indicator Scale: Bearish, Mildly Bearish, Sideways, Mildly Bullish, Bullish  Turned 
stock-summaryShareholding
Shareholding Snapshot : Jun 2026stock-summary
Shareholding Compare (%holding) stock-summary
Majority shareholders

Non Institution

Pledged Promoter Holdings

None

Mutual Funds

Held by 0 Schemes

FIIs

Held by 100025000 FIIs (13.28%)

Promoter with highest holding

Yarlagadda Janaki (38.06%)

Highest Public shareholder

Siraj Holding Llc (23.33%)

Individual Investors Holdings

14.42%

stock-summaryFinancial
[
  {
    "link": "quarterly",
    "btn_text": "All Quarterly Results",
    "header": "Quarterly Results Snapshot (Consolidated) - Jun'26 - QoQ",
    "rhs": [
      {
        "prefix": "Net Sales ",
        "suffix": "QoQ Growth in quarter ended Jun 2026 is 5.41% vs 4.56% in Mar 2026",
        "dir": 1
      },
      {
        "prefix": "Consolidated Net Profit ",
        "suffix": "QoQ Growth in quarter ended Jun 2026 is 48.22% vs -34.82% in Mar 2026",
        "dir": 1
      }
    ],
    "table": {
      "header": [
        "Jun'26",
        "Mar'26",
        "Change(%)"
      ],
      "body": [
        {
          "field": "Net Sales",
          "val1": "292.52",
          "val2": "277.52",
          "chgp": "5.41%",
          "chgp_class": "positive"
        },
        {
          "field": "Operating Profit (PBDIT) excl Other Income",
          "val1": "59.61",
          "val2": "47.82",
          "chgp": "24.65%",
          "chgp_class": "positive"
        },
        {
          "field": "Interest",
          "val1": "4.56",
          "val2": "4.45",
          "chgp": "2.47%",
          "chgp_class": "negative"
        },
        {
          "field": "Exceptional Items",
          "val1": "0.00",
          "val2": "0.00",
          "chgp": "",
          "chgp_class": "neutral"
        },
        {
          "field": "Consolidate Net Profit",
          "val1": "17.95",
          "val2": "12.11",
          "chgp": "48.22%",
          "chgp_class": "positive"
        },
        {
          "field": "Operating Profit Margin (Excl OI)",
          "val1": "20.38%",
          "val2": "17.23%",
          "chgp": "3.15%",
          "chgp_class": "positive"
        }
      ]
    }
  },
  {
    "link": "half-yearly",
    "btn_text": "All Half Yearly Results",
    "header": "Half Yearly Results Snapshot (Consolidated) - Sep'25",
    "rhs": [
      {
        "prefix": "Net Sales ",
        "suffix": " Growth in half year ended Sep 2025 is -1.62% vs 284.37% in Sep 2024",
        "dir": -1
      },
      {
        "prefix": "Consolidated Net Profit ",
        "suffix": " Growth in half year ended Sep 2025 is 36.56% vs 536.44% in Sep 2024",
        "dir": -1
      }
    ],
    "table": {
      "header": [
        "Sep'25",
        "Sep'24",
        "Change(%)"
      ],
      "body": [
        {
          "field": "Net Sales",
          "val1": "458.97",
          "val2": "466.51",
          "chgp": "-1.62%",
          "chgp_class": "negative"
        },
        {
          "field": "Operating Profit (PBDIT) excl Other Income",
          "val1": "45.02",
          "val2": "36.20",
          "chgp": "24.36%",
          "chgp_class": "positive"
        },
        {
          "field": "Interest",
          "val1": "1.07",
          "val2": "4.94",
          "chgp": "-78.34%",
          "chgp_class": "positive"
        },
        {
          "field": "Exceptional Items",
          "val1": "0.00",
          "val2": "0.00",
          "chgp": "",
          "chgp_class": "neutral"
        },
        {
          "field": "Consolidate Net Profit",
          "val1": "29.81",
          "val2": "21.83",
          "chgp": "36.56%",
          "chgp_class": "positive"
        },
        {
          "field": "Operating Profit Margin (Excl OI)",
          "val1": "9.81%",
          "val2": "7.76%",
          "chgp": "2.05%",
          "chgp_class": "positive"
        }
      ]
    }
  },
  {
    "link": "nine-monthly",
    "btn_text": "All Nine Monthly Results",
    "header": "Nine Monthly Results Snapshot (Consolidated) - Dec'25",
    "rhs": [
      {
        "prefix": "Net Sales ",
        "suffix": "YoY Growth in nine months ended Dec 2025 is 18.13% vs 112.12% in Dec 2024",
        "dir": -1
      },
      {
        "prefix": "Consolidated Net Profit ",
        "suffix": "YoY Growth in nine months ended Dec 2025 is 54.95% vs 316.40% in Dec 2024",
        "dir": -1
      }
    ],
    "table": {
      "header": [
        "Dec'25",
        "Dec'24",
        "Change(%)"
      ],
      "body": [
        {
          "field": "Net Sales",
          "val1": "724.38",
          "val2": "613.23",
          "chgp": "18.13%",
          "chgp_class": "positive"
        },
        {
          "field": "Operating Profit (PBDIT) excl Other Income",
          "val1": "77.57",
          "val2": "51.62",
          "chgp": "50.27%",
          "chgp_class": "positive"
        },
        {
          "field": "Interest",
          "val1": "5.68",
          "val2": "6.29",
          "chgp": "-9.70%",
          "chgp_class": "positive"
        },
        {
          "field": "Exceptional Items",
          "val1": "0.00",
          "val2": "0.00",
          "chgp": "",
          "chgp_class": "neutral"
        },
        {
          "field": "Consolidate Net Profit",
          "val1": "48.39",
          "val2": "31.23",
          "chgp": "54.95%",
          "chgp_class": "positive"
        },
        {
          "field": "Operating Profit Margin (Excl OI)",
          "val1": "10.71%",
          "val2": "8.42%",
          "chgp": "2.29%",
          "chgp_class": "positive"
        }
      ]
    }
  },
  {
    "link": "annual",
    "btn_text": "All Annual Results",
    "header": "Annual Results Snapshot (Consolidated) - Mar'26",
    "rhs": [
      {
        "prefix": "Net Sales ",
        "suffix": "YoY Growth in year ended Mar 2026 is 25.73% vs 58.68% in Mar 2025",
        "dir": -1
      },
      {
        "prefix": "Consolidated Net Profit ",
        "suffix": "YoY Growth in year ended Mar 2026 is 36.66% vs 175.31% in Mar 2025",
        "dir": -1
      }
    ],
    "table": {
      "header": [
        "Mar'26",
        "Mar'25",
        "Change(%)"
      ],
      "body": [
        {
          "field": "Net Sales",
          "val1": "1,001.90",
          "val2": "796.86",
          "chgp": "25.73%",
          "chgp_class": "positive"
        },
        {
          "field": "Operating Profit (PBDIT) excl Other Income",
          "val1": "125.39",
          "val2": "70.21",
          "chgp": "78.59%",
          "chgp_class": "positive"
        },
        {
          "field": "Interest",
          "val1": "10.14",
          "val2": "7.54",
          "chgp": "34.48%",
          "chgp_class": "negative"
        },
        {
          "field": "Exceptional Items",
          "val1": "0.00",
          "val2": "0.00",
          "chgp": "",
          "chgp_class": "neutral"
        },
        {
          "field": "Consolidate Net Profit",
          "val1": "60.50",
          "val2": "44.27",
          "chgp": "36.66%",
          "chgp_class": "positive"
        },
        {
          "field": "Operating Profit Margin (Excl OI)",
          "val1": "12.52%",
          "val2": "8.81%",
          "chgp": "3.71%",
          "chgp_class": "positive"
        }
      ]
    }
  }
]

Quarterly Results Snapshot (Consolidated) - Jun'26 - QoQstock-summary

Jun'26
Mar'26
Change(%)
Net Sales
292.52
277.52
5.41%
Operating Profit (PBDIT) excl Other Income
59.61
47.82
24.65%
Interest
4.56
4.45
2.47%
Exceptional Items
0.00
0.00
Consolidate Net Profit
17.95
12.11
48.22%
Operating Profit Margin (Excl OI)
20.38%
17.23%
3.15%
Values in Rs Cr.
Direction Arrows
Net Sales

QoQ Growth in quarter ended Jun 2026 is 5.41% vs 4.56% in Mar 2026

Direction Arrows
Consolidated Net Profit

QoQ Growth in quarter ended Jun 2026 is 48.22% vs -34.82% in Mar 2026

Half Yearly Results Snapshot (Consolidated) - Sep'25stock-summary

Sep'25
Sep'24
Change(%)
Net Sales
458.97
466.51
-1.62%
Operating Profit (PBDIT) excl Other Income
45.02
36.20
24.36%
Interest
1.07
4.94
-78.34%
Exceptional Items
0.00
0.00
Consolidate Net Profit
29.81
21.83
36.56%
Operating Profit Margin (Excl OI)
9.81%
7.76%
2.05%
Values in Rs Cr.
Direction Arrows
Net Sales

Growth in half year ended Sep 2025 is -1.62% vs 284.37% in Sep 2024

Direction Arrows
Consolidated Net Profit

Growth in half year ended Sep 2025 is 36.56% vs 536.44% in Sep 2024

Nine Monthly Results Snapshot (Consolidated) - Dec'25stock-summary

Dec'25
Dec'24
Change(%)
Net Sales
724.38
613.23
18.13%
Operating Profit (PBDIT) excl Other Income
77.57
51.62
50.27%
Interest
5.68
6.29
-9.70%
Exceptional Items
0.00
0.00
Consolidate Net Profit
48.39
31.23
54.95%
Operating Profit Margin (Excl OI)
10.71%
8.42%
2.29%
Values in Rs Cr.
Direction Arrows
Net Sales

YoY Growth in nine months ended Dec 2025 is 18.13% vs 112.12% in Dec 2024

Direction Arrows
Consolidated Net Profit

YoY Growth in nine months ended Dec 2025 is 54.95% vs 316.40% in Dec 2024

Annual Results Snapshot (Consolidated) - Mar'26stock-summary

Mar'26
Mar'25
Change(%)
Net Sales
1,001.90
796.86
25.73%
Operating Profit (PBDIT) excl Other Income
125.39
70.21
78.59%
Interest
10.14
7.54
34.48%
Exceptional Items
0.00
0.00
Consolidate Net Profit
60.50
44.27
36.66%
Operating Profit Margin (Excl OI)
12.52%
8.81%
3.71%
Values in Rs Cr.
Direction Arrows
Net Sales

YoY Growth in year ended Mar 2026 is 25.73% vs 58.68% in Mar 2025

Direction Arrows
Consolidated Net Profit

YoY Growth in year ended Mar 2026 is 36.66% vs 175.31% in Mar 2025

stock-summaryCompany CV
About Blue Cloud Softech Solutions Ltd stock-summary
stock-summary
Blue Cloud Softech Solutions Ltd
Micro Cap
Software Products
Blue Cloud Softech Solutions Ltd. (Formerly known Adithya Aquaculture Limited was incorporated on August 28th, 1991 as a Private Limited Company in Hyderabad and later was converted into a Public Limited Company with effect from April 4th, 1994.
Company Coordinates stock-summary
Company Details
1-2-286, Domalguda Hyderabad Telangana : 500029
stock-summary
Tel:
stock-summary
csadithyaaquaculture@gmail.com
Registrar Details
Aarthi Consultants Pvt Ltd, 1-2-285 , Domalaguda, Hyderabad