
Compare Blue Cloud Soft. with Similar Stocks
Dashboard
Despite the size of the company, domestic mutual funds hold only 0% of the company
- Domestic mutual funds have capability to do in-depth on-the-ground research on companies- their small stake may signify either they are not comfortable at the price or the business
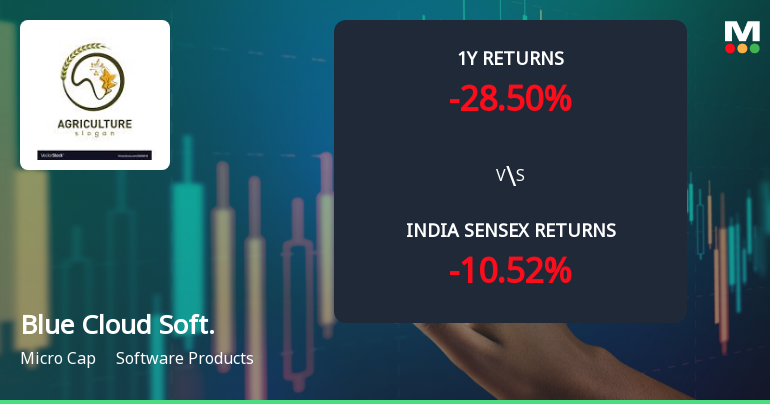
Below par performance in long term as well as near term
Stock DNA
Software Products
INR 1,371 Cr (Micro Cap)
23.00
20
0.00%
0.29
6.55%
1.46
Total Returns (Price + Dividend) 
Latest dividend: 0.02 per share ex-dividend date: Oct-11-2024
Risk Adjusted Returns v/s
Returns Beta

News
Blue Cloud Softech Solutions Ltd: Technical Momentum Shifts Amid Prolonged Downtrend
Blue Cloud Softech Solutions Ltd, a micro-cap player in the Software Products sector, has experienced a notable shift in its technical parameters, reflecting a complex interplay of bullish and bearish signals. Despite a modest day gain of 0.34%, the stock’s momentum and technical indicators reveal a nuanced picture that investors should carefully analyse.
Read full news article
Blue Cloud Softech Solutions Ltd Faces Bearish Momentum Amid Technical Downgrade
Blue Cloud Softech Solutions Ltd, a micro-cap player in the Software Products sector, has experienced a notable shift in its technical momentum, signalling increased bearish pressure. Recent technical indicators reveal a deteriorating trend, with the company’s Mojo Grade downgraded from Hold to Sell as of 17 Nov 2025, reflecting growing investor caution amid weakening price action and subdued market sentiment.
Read full news article
Blue Cloud Softech Solutions Ltd Technical Momentum Shifts Amid Bearish Sentiment
Blue Cloud Softech Solutions Ltd, a micro-cap player in the Software Products sector, has experienced a subtle shift in its technical momentum, moving from a bearish to a mildly bearish trend. Despite a modest day gain of 1.56% to close at ₹18.24 on 10 Jun 2026, the stock’s broader technical indicators and price action reveal a complex picture that investors should carefully analyse.
Read full news article Announcements
Announcement under Regulation 30 (LODR)-Earnings Call Transcript
10-Jun-2026 | Source : BSESubmission of Transcript for the Earnings Conference Call held for Q4 and Year ended 31st March 2026
Announcement under Regulation 30 (LODR)-Change in Management
10-Jun-2026 | Source : BSEOutcome of Board Meeting -Appointment and Resignation of Chief Financial Officer of the Company pursuant to Regulation 30 of the Securities Exchange Board of India (Listing Obligations and Disclosure Requirement) Regulations 2015 (Listing Regulations).
Announcement under Regulation 30 (LODR)-Analyst / Investor Meet - Outcome
05-Jun-2026 | Source : BSESub: Disclosure of audio recording of the earnings conference call with analysts and investors held on June 5 2026 on the audited financial results for the fourth quarter and year ended March 31 2026 under Regulation 30 read with Regulation 46(2) of the SEBI (LODR) Regulations 2015.
Corporate Actions

No Upcoming Board Meetings

Blue Cloud Softech Solutions Ltd has declared 1% dividend, ex-date: 11 Oct 24

Blue Cloud Softech Solutions Ltd has announced 1:2 stock split, ex-date: 20 Jan 25

No Bonus history available

No Rights history available
Quality key factors
Valuation key factors
Technicals key factors
 Technical Indicator Scale: Bearish, Mildly Bearish, Sideways, Mildly Bullish, Bullish Turned
 Shareholding Snapshot : Mar 2026
Shareholding Compare (%holding)
Non Institution
None
Held by 0 Schemes
Held by 3 FIIs (13.29%)
Yarlagadda Janaki (38.06%)
Siraj Holding Llc (23.33%)
13.16%
Quarterly Results Snapshot (Consolidated) - Mar'26 - QoQ

QoQ Growth in quarter ended Mar 2026 is 4.56% vs 4.94% in Dec 2025
QoQ Growth in quarter ended Mar 2026 is -34.82% vs 20.49% in Dec 2025
Half Yearly Results Snapshot (Consolidated) - Sep'25
Growth in half year ended Sep 2025 is -1.62% vs 284.37% in Sep 2024
Growth in half year ended Sep 2025 is 36.56% vs 536.44% in Sep 2024
Nine Monthly Results Snapshot (Consolidated) - Dec'25
YoY Growth in nine months ended Dec 2025 is 18.13% vs 112.12% in Dec 2024
YoY Growth in nine months ended Dec 2025 is 54.95% vs 316.40% in Dec 2024
Annual Results Snapshot (Consolidated) - Mar'26
YoY Growth in year ended Mar 2026 is 25.73% vs 58.68% in Mar 2025
YoY Growth in year ended Mar 2026 is 36.66% vs 175.31% in Mar 2025
About Blue Cloud Softech Solutions Ltd

Company Coordinates


