
Compare Bodhi Tree with Similar Stocks
Stock DNA
Media & Entertainment
INR 120 Cr (Micro Cap)
19.00
20
0.00%
0.40
7.69%
1.42
Total Returns (Price + Dividend) 
Latest dividend: 0.5 per share ex-dividend date: Feb-29-2024
Risk Adjusted Returns v/s
Returns Beta

News

Bodhi Tree Multimedia Ltd Upgraded to Sell: Detailed Analysis of Financial and Market Trends
Bodhi Tree Multimedia Ltd has seen its investment rating upgraded from Strong Sell to Sell as of 2 June 2026, reflecting a nuanced shift in its overall assessment. While the company’s financial trend has flattened, improvements in quality metrics and technical indicators have contributed to a more favourable outlook, albeit tempered by ongoing challenges in profitability and market performance.
Read full news articleAre Bodhi Tree Multimedia Ltd latest results good or bad?
Bodhi Tree Multimedia Ltd's latest financial results for Q4 FY26 present a mixed picture. The company reported a consolidated net profit of ₹1.87 crores, reflecting a sequential recovery of 28.97% from the previous quarter, although this represents a year-on-year decline of 15.77%. This indicates ongoing challenges in maintaining profitability compared to the same period last year. Net sales for the quarter were ₹34.96 crores, which shows a decline of 10.40% from the previous quarter and a 13.06% decrease year-on-year. This revenue contraction raises concerns about the company's ability to sustain sales growth, as it has experienced significant volatility in net sales over recent quarters. On a positive note, the operating margin (excluding other income) improved to 13.84%, up from 10.53% in the previous quarter, driven by better cost management. However, the profit after tax (PAT) margin slightly decreas...
Read full news article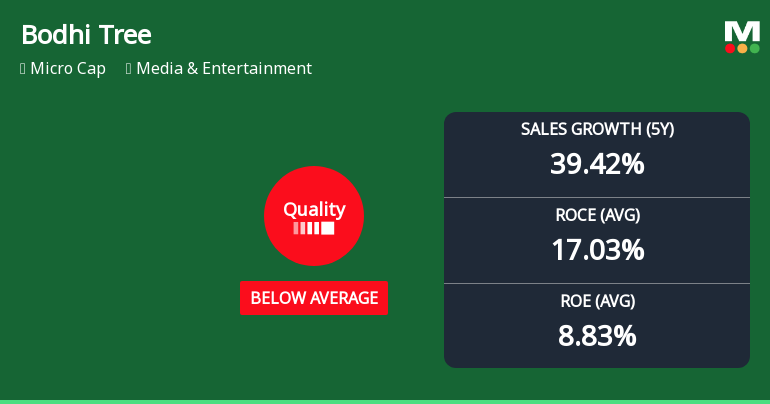
Bodhi Tree Multimedia Ltd Quality Grade Downgrade Highlights Fundamental Challenges
Bodhi Tree Multimedia Ltd has seen its quality grade downgraded from average to below average, reflecting a deterioration in key business fundamentals. Despite a robust five-year sales growth of 39.4%, the company’s return metrics, debt levels, and shareholder confidence indicators reveal mounting concerns for investors in this micro-cap media and entertainment player.
Read full news article Announcements
Announcement under Regulation 30 (LODR)-Analyst / Investor Meet - Outcome
09-Jun-2026 | Source : BSEAudio Recording of Earning Conference Call discussing Q4 H2 FY2026 Results. Pursuant
Announcement under Regulation 30 (LODR)-Newspaper Publication
02-Jun-2026 | Source : BSESubmission of Newspaper Advertisement for Financial Result for quarter and year ended March 31 2026
Board Meeting Outcome for Outcome Of The Meeting Of Board Of Directors Held On 30Th May 2026
30-May-2026 | Source : BSEOutcome of the Meeting of Board of Directors held on 30th May 2026
Corporate Actions

No Upcoming Board Meetings

Bodhi Tree Multimedia Ltd has declared 5% dividend, ex-date: 29 Feb 24

Bodhi Tree Multimedia Ltd has announced 1:10 stock split, ex-date: 05 Apr 24

Bodhi Tree Multimedia Ltd has announced 4:1 bonus issue, ex-date: 23 Sep 22

Bodhi Tree Multimedia Ltd has announced 4:9 rights issue, ex-date: 24 Mar 25
Quality key factors
Valuation key factors
Technicals key factors
 Technical Indicator Scale: Bearish, Mildly Bearish, Sideways, Mildly Bullish, Bullish Turned
 Shareholding Snapshot : Mar 2026
Shareholding Compare (%holding)
Non Institution
55.8686
Held by 0 Schemes
Held by 1 FIIs (0.39%)
Mautik Ajit Tolia (24.21%)
Augmenta Value Trust - Scheme 1 (9.31%)
42.02%
Quarterly Results Snapshot (Consolidated) - Mar'26 - QoQ

QoQ Growth in quarter ended Mar 2026 is -10.40% vs 66.75% in Dec 2025

QoQ Growth in quarter ended Mar 2026 is 28.97% vs -44.87% in Dec 2025
Half Yearly Results Snapshot (Consolidated) - Sep'25
Growth in half year ended Sep 2025 is 29.67% vs 9.54% in Sep 2024
Growth in half year ended Sep 2025 is 146.77% vs -37.69% in Sep 2024
Nine Monthly Results Snapshot (Consolidated) - Dec'25
YoY Growth in nine months ended Dec 2025 is 64.74% vs 16.05% in Dec 2024
YoY Growth in nine months ended Dec 2025 is 68.91% vs 48.33% in Dec 2024
Annual Results Snapshot (Consolidated) - Mar'26
YoY Growth in year ended Mar 2026 is 29.63% vs 39.22% in Mar 2025
YoY Growth in year ended Mar 2026 is 30.74% vs 43.95% in Mar 2025
About Bodhi Tree Multimedia Ltd

Company Coordinates


