
Dashboard
With a growth in Net Sales of 661.4%, the company declared Very Positive results in Jun 25
- NET SALES(HY) Higher at USD 1.47 MM
- RAW MATERIAL COST(Y) Fallen by -106.89% (YoY)
- DEBTORS TURNOVER RATIO(HY) Highest at 7.95 times
Risky -
Consistent Underperformance against the benchmark over the last 3 years
Total Returns (Price + Dividend) 
Bolt Projects Holdings, Inc. for the last several years.
Risk Adjusted Returns v/s
News
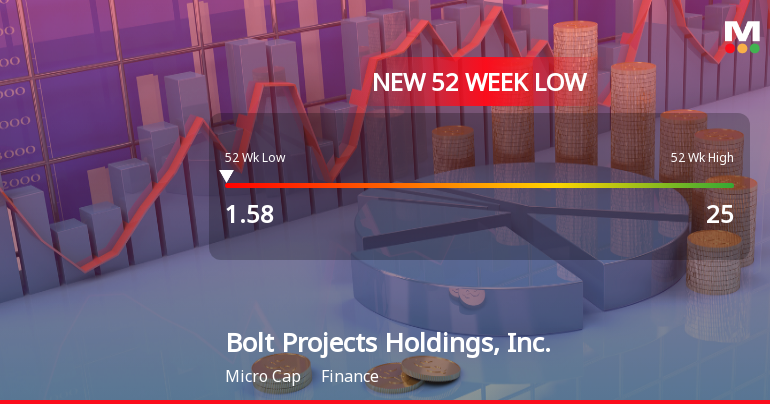
Bolt Projects Holdings Hits New 52-Week Low at USD 1.58
Bolt Projects Holdings, Inc. has reached a new 52-week low, reflecting a significant decline of 70% over the past year. The company, with a market capitalization of approximately USD 11 million, faces financial challenges, including negative debt equity and return on equity metrics, despite some recent positive developments.
Read MoreIs Bolt Projects Holdings, Inc. technically bullish or bearish?
As of 12 September 2025, the technical trend for Bolt Projects Holdings, Inc. has changed from mildly bullish to mildly bearish. The current stance is mildly bearish, primarily driven by the daily moving averages indicating a bearish trend and the weekly RSI also showing bearish momentum. While the MACD remains mildly bullish on the weekly and monthly charts, the overall indicators suggest weakness. Additionally, the stock has significantly underperformed compared to the S&P 500 across multiple periods, with a year-to-date return of -62.97% versus the S&P 500's 12.22%....
Read MoreIs Bolt Projects Holdings, Inc. overvalued or undervalued?
As of 9 November 2023, the valuation grade for Bolt Projects Holdings, Inc. has moved from does not qualify to risky, indicating increased concerns about its financial health. The company appears to be overvalued, as evidenced by its negative P/E ratio of -0.3018 and an EV to EBITDA ratio of -0.6193, which are significantly worse than typical industry benchmarks. In comparison to its peers, Bolt Projects Holdings, Inc. shows a stark contrast with companies in the finance sector, where positive valuations are expected. For instance, while Bolt's P/E ratio is negative, other firms in the industry likely maintain positive ratios, reflecting healthier financial positions. Furthermore, the company's stock has underperformed relative to the S&P 500, with a year-to-date return of -62.97% compared to the index's 12.22%, reinforcing the notion of overvaluation amidst poor performance....
Read More Announcements

Corporate Actions
Quality key factors
Valuation key factors
Technicals key factors
 Technical Indicator Scale: Bearish, Mildly Bearish, Sideways, Mildly Bullish, Bullish Turned
 Shareholding Snapshot
Shareholding Compare (%holding)
Quarterly Results Snapshot (Consolidated) - Jun'25 - QoQ

QoQ Growth in quarter ended Jun 2025 is 550.00% vs -84.62% in Mar 2025
QoQ Growth in quarter ended Jun 2025 is 23.33% vs 4.76% in Mar 2025
Annual Results Snapshot (Consolidated) - Dec'24

YoY Growth in year ended Dec 2024 is -58.82% vs 0.00% in Dec 2023
YoY Growth in year ended Dec 2024 is -13.34% vs -688.78% in Dec 2023


